Filing Flows › Communication Services › Globalstar (GSAT)
Globalstar (GSAT) earnings and revenue breakdown
Latest: Q3 2026 · 10-Q filed Nov 5, 2026 · Globalstar (GSAT) Q3 2026 earnings results →
Q3 2026 Revenue down 4% year over year to $70.9M · 22¢ of every $1 of revenue lost · operating margin 10.7%
Globalstar made $70.9M in Q3 2026 (-4% Y/Y): Total service revenue $65.4M, Subscriber equipment sales $5.5M. Operating margin 10.7%, net loss $15.7M. See where every dollar goes — costs, profit and cash — as a Sankey from the 10-Q filed Nov 5, 2026.
Drawing the Sankey…
Open the interactive Sankey → click any line for what the company wrote about it, compare Y/Y and Q/Q, export as PNG or PDF
What changed this quarter
Revenue was $70.9M in Q3 2026, down 4% year over year and up 9% from the previous quarter. Wholesale capacity services was the largest line at 63% of revenue. Wholesale capacity services lost $2.7M year over year (down 6%), 93% of the total change.
Operating profit was $7.6M, a 10.7% margin (down 3.0 points year over year). Total costs fell 1% while revenue fell 4%. The fastest-growing cost line was SG&A (+30%). The quarter ended with a net loss of $15.7M, narrower than the previous quarter's $26.5M loss. Net interest and other expense of $21.9M was the main reason.
Operating cash flow was $137.1M (down 42% year over year). Non-cash charges added back $16.9M of depreciation and amortization and $2.5M of share-based compensation. Working capital and other items added $133.4M. Capital expenditures of $14.8M left free cash flow of $122.3M.
Quarterly history
| Quarter | Form | Filed | Revenue | Y/Y | Op. margin | Net earnings | Op. cash flow |
|---|---|---|---|---|---|---|---|
| Q3 2026 | 10-Q | Nov 5, 2026 | $70.9M | -4% | 10.7% | −$15.7M | $137M |
| Q2 2026 | 10-Q | Aug 6, 2026 | $64.8M | -4% | -7.4% | −$26.5M | $125M |
| Q1 2026 | 10-Q | May 7, 2026 | $70.1M | +17% | 11.7% | −$17.4M | $35.2M |
| Q4 2025 | 10-K | Feb 27, 2026 | $72.0M | +18% | -0.5% | −$11.6M | $176M |
| Q3 2025 | 10-Q | Nov 6, 2025 | $73.8M | +2% | 13.8% | $1.1M | $236M |
| Q2 2025 | 10-Q | Aug 7, 2025 | $67.1M | +11% | 9.2% | $19.2M | $158M |
| Q1 2025 | 10-Q | May 8, 2025 | $60.0M | +6% | -14.2% | −$17.3M | $51.9M |
Charts
In supply chains and themes
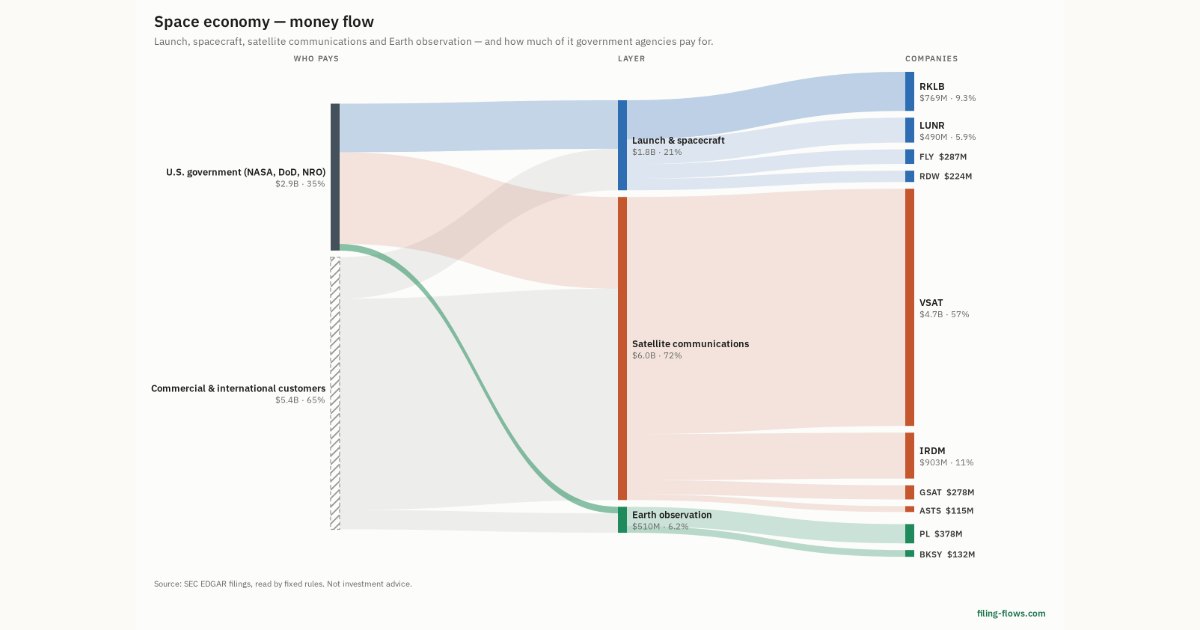
Interactive views
The same charts as the app — open one to draw it.
💵Where each $1 goesinteractive
Loading the interactive chart…
🌏Named in Asian annual reportsinteractive
Loading the interactive chart…
🔄Rotation against the market and its industry (RRG)interactive
Loading the interactive chart…
🔍Earnings qualityinteractive
Loading the interactive chart…
⚖️Fair value by methodinteractive
Loading the interactive chart…
🔭Outlook & guidanceinteractive
Loading the interactive chart…
📈Investments: gains and what it boughtinteractive
Loading the interactive chart…
🏭Its industry’s money flow (input-output)interactive
Loading the interactive chart…
About Globalstar
Through its global satellite network, Globalstar, Inc. (“we,” “us” or the “Company”) provides Mobile Satellite Services (“MSS”), including voice and data communications services to retail, business and governmental customers as well as wholesale satellite capacity services. We offer these services over our network of in-orbit satellites and ground stations (“gateways”) pursuant to our spectrum licenses, which we refer to collectively as the Globalstar System. In addition to supporting Internet of Things ("IoT") data transmissions in a variety of applications, we provide reliable connectivity in areas not served or underserved by terrestrial wireless and wireline networks and in circumstances where terrestrial networks are not operational due to natural or man-made disasters.
In its own words, from its 10-K, filed Feb 27, 2026.
Globalstar against its Communications Services, NEC peers
The largest companies of the same SEC industry, each at its latest quarter. Revenue growth: -4% against the peers' median +3%. Operating margin: 10.7% against the peers' median 5.5%.
| Company | Quarter | Revenue | Y/Y | Op. margin |
|---|---|---|---|---|
| GSAT Globalstar | Q3 2026 | $70.9M | -4% | 10.7% |
| VSAT Viasat | Q2 FY27 | $1.2B | +3% | 0.6% |
| ECHO EchoStar | Q3 2026 | $1.1B | -69% | 13.1% |
| CALX Calix | Q3 2026 | $302M | +14% | 5.5% |
| IRDM Iridium Communications | Q3 2026 | $246M | +8% | 12.9% |
| CCOI Cogent Communications Holdings | Q3 2026 | $231M | -4% | -3.0% |
| GOGO Gogo | Q3 2026 | $213M | -5% | 8.0% |
| KVHI KVH Industries | Q3 2026 | $38.4M | +35% | -3.2% |
| ASTS AST SpaceMobile | Q2 2026 | $31.5M | 27× | -948.0% |
Source: Globalstar 10-Q on SEC EDGAR · CIK 1366868 · Communications Services, NEC
Guidance and outlook
13F: who owns GSAT and who is buying
More on GSAT
History
Every quarter: Q3 2026 results · Q2 2026 results · Q1 2026 results · Q4 2025 results · Q3 2025 results · Q2 2025 results · Q1 2025 results