Filing Flows › Financials › TPG (TPG)
TPG (TPG) earnings and revenue breakdown
Latest: Q3 2026 · 10-Q filed Nov 3, 2026 · TPG (TPG) Q3 2026 earnings results →
Q3 2026 Revenue down 0% year over year to $1.2B · 8¢ of every $1 of revenue kept as net profit · operating margin 26.4%
TPG made $1.2B in Q3 2026 (-0.2% Y/Y): Management fees $573M, Other revenues $508M, Expense reimbursements and other $67.6M. Operating margin 26.4%, net earnings $99.6M. See where every dollar goes — costs, profit and cash — as a Sankey from the 10-Q filed Nov 3, 2026.
Drawing the Sankey…
Open the interactive Sankey → click any line for what the company wrote about it, compare Y/Y and Q/Q, export as PNG or PDF
What changed this quarter
Revenue was $1.2B in Q3 2026, roughly flat year over year and down 34% from the previous quarter. Management fees was the largest line at 47% of revenue. Expense reimbursements and other lost $0.01B year over year (down 15%), 487% of the total change.
Operating profit was $0.32B, a 26.4% margin (up 7.7 points year over year). Total costs fell 10% while revenue was flat. Net earnings were $0.10B, up 48% year over year. The effective tax rate was 18.0%.
Operating cash flow was $0.25B (down 49% year over year), 94% of net income including minority interests. Non-cash charges added back $0.04B of depreciation and amortization and $0.21B of share-based compensation. Working capital and other items used $0.27B.
Quarterly history
| Quarter | Form | Filed | Revenue | Y/Y | Op. margin | Net earnings | Op. cash flow |
|---|---|---|---|---|---|---|---|
| Q3 2026 | 10-Q | Nov 3, 2026 | $1.2B | -0.2% | 26.4% | $99.6M | $249M |
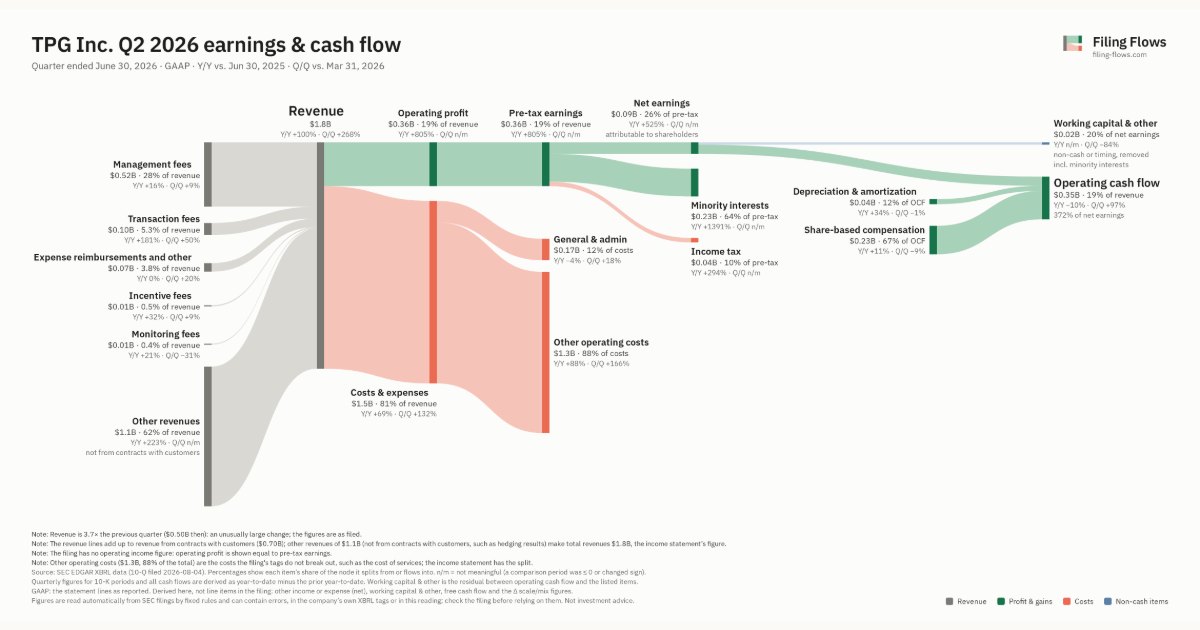
| Q2 2026 | 10-Q | Aug 4, 2026 | $1.8B | +100% | 19.3% | $93.4M | $348M |
| Q1 2026 | 10-Q | May 1, 2026 | $500M | -52% | -28.1% | −$123M | $177M |
| Q4 2025 | 10-K | Feb 17, 2026 | $1.5B | +38% | 20.4% | $77.1M | −$43.7M |
| Q3 2025 | 10-Q | Nov 4, 2025 | $1.2B | +43% | 18.6% | $67.1M | $492M |
| Q2 2025 | 10-Q | Aug 6, 2025 | $921M | +24% | 4.3% | $14.9M | $386M |
| Q1 2025 | 10-Q | May 7, 2025 | $1.0B | +26% | 9.1% | $25.4M | $198M |
Charts
Interactive views
The same charts as the app — open one to draw it.
💵Where each $1 goesinteractive
Loading the interactive chart…
🌏Named in Asian annual reportsinteractive
Loading the interactive chart…
🔄Rotation against the market and its industry (RRG)interactive
Loading the interactive chart…
🔍Earnings qualityinteractive
Loading the interactive chart…
⚖️Fair value by methodinteractive
Loading the interactive chart…
🔭Outlook & guidanceinteractive
Loading the interactive chart…
📈Investments: gains and what it boughtinteractive
Loading the interactive chart…
🏭Its industry’s money flow (input-output)interactive
Loading the interactive chart…
About TPG
TPG is a leading global alternative asset manager with $303.0 billion in assets under management (“AUM”) as of December 31, 2025. We have built our firm through years of successful innovation and growth, and believe that we have delivered attractive risk-adjusted returns to our clients and established a premier investment business focused on the fastest-growing segments of the alternative asset management industry. We believe our distinctive business approach and diversified array of innovative investment platforms position us well to continue generating highly profitable, sustainable growth.
In its own words, from its 10-K, filed Feb 17, 2026.
TPG against its Investment Advice peers
The largest companies of the same SEC industry, each at its latest quarter. Revenue growth: -0.2% against the peers' median +6%. Operating margin: 26.4% against the peers' median 26.4%.
| Company | Quarter | Revenue | Y/Y | Op. margin |
|---|---|---|---|---|
| TPG TPG | Q3 2026 | $1.2B | -0.2% | 26.4% |
| KKR KKR | Q2 2026 | $5.7B | +12% | 24.0% |
| AMP Ameriprise Financial | Q3 2026 | $5.2B | +6% | 28.9% |
| APO Apollo Global Management | Q3 2026 | $4.7B | -52% | -30.9% |
| BX Blackstone | Q3 2026 | $3.1B | -0.8% | 46.9% |
| BEN Franklin Templeton | Q4 FY26 | $2.4B | +4% | 14.6% |
| TROW Price T Rowe Group | Q3 2026 | $2.0B | +6% | 38.4% |
| IVZ Invesco | Q3 2026 | $1.9B | +14% | 23.3% |
| BAM Brookfield Asset Management | Q2 2026 | $1.8B | +61% | 62.4% |
Source: TPG 10-Q on SEC EDGAR · CIK 1880661 · Investment Advice
Guidance and outlook
13F: who owns TPG and who is buying
More on TPG
History
Every quarter: Q3 2026 results · Q2 2026 results · Q1 2026 results · Q4 2025 results · Q3 2025 results · Q2 2025 results · Q1 2025 results