Filing Flows › Materials › Tapestry (TPR)
Tapestry (TPR) earnings and revenue breakdown
Latest: Q1 FY27 · 10-Q filed Nov 5, 2026 · Tapestry (TPR) Q1 FY27 earnings results →
Q1 FY27 Revenue up 11% year over year to $1.9B · 19¢ of every $1 of revenue kept as net profit · operating margin 22.4%
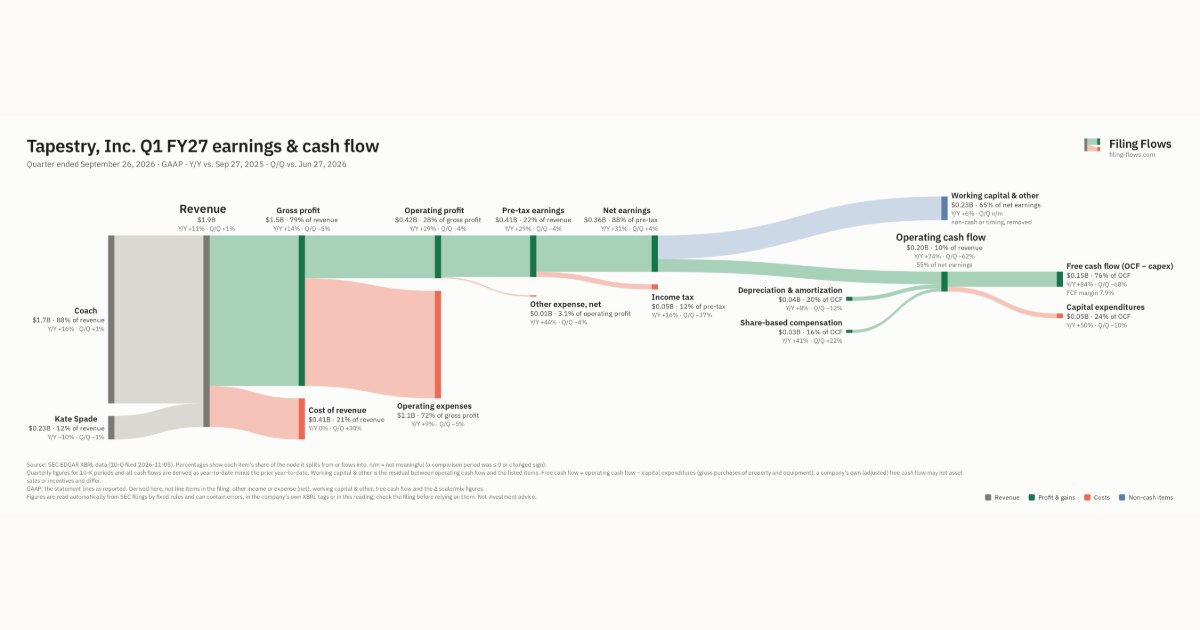
Tapestry made $1.9B in Q1 FY27 (+11% Y/Y): Coach $1.7B, Kate Spade $233M. Operating margin 22.4%, net earnings $360M. See where every dollar goes — costs, profit and cash — as a Sankey from the 10-Q filed Nov 5, 2026.
Drawing the Sankey…
Open the interactive Sankey → click any line for what the company wrote about it, compare Y/Y and Q/Q, export as PNG or PDF
What changed this quarter
Revenue was $1.9B in Q1 FY27, up 11% year over year and up 1% from the previous quarter. Coach was the largest line at 88% of revenue. Coach added $0.23B year over year (up 16%), 122% of the total change. Kate Spade declined 10%.
Gross margin was 78.6%, up 2.3 points from Q1 FY26. Operating profit was $0.42B, a 22.4% margin (up 3.1 points year over year). Of the extra revenue versus Q1 FY26, 51% reached operating profit, above the 19% margin then. Operating expenses grew 9% against revenue growth of 11%. Net earnings were $0.36B, up 31% year over year. The effective tax rate was 12.4%.
Operating cash flow was $0.20B (up 74% year over year), 55% of net earnings. Non-cash charges added back $0.04B of depreciation and amortization and $0.03B of share-based compensation. Working capital and other items used $0.23B. Capital expenditures of $0.05B left free cash flow of $0.15B.
Quarterly history
| Quarter | Form | Filed | Revenue | Y/Y | Op. margin | Net earnings | Op. cash flow |
|---|---|---|---|---|---|---|---|
| Q1 FY27 | 10-Q | Nov 5, 2026 | $1.9B | +11% | 22.4% | $360M | $197M |
| Q4 FY26 | 10-K | Aug 13, 2026 | $1.9B | +9% | 23.6% | $348M | $522M |
| Q3 FY26 | 10-Q | May 7, 2026 | $1.9B | +21% | 22.3% | $344M | $263M |
| Q2 FY26 | 10-Q | Feb 5, 2026 | $2.5B | +14% | 28.6% | $561M | $1.1B |
| Q1 FY26 | 10-Q | Nov 6, 2025 | $1.7B | +13% | 19.2% | $275M | $113M |
| Q4 FY25 | 10-K | Aug 14, 2025 | $1.7B | +8% | -33.9% | −$517M | $447M |
| Q3 FY25 | 10-Q | May 8, 2025 | $1.6B | +7% | 16.0% | $203M | $144M |
Charts
Interactive views
The same charts as the app — open one to draw it.
💵Where each $1 goesinteractive
Loading the interactive chart…
🌏Named in Asian annual reportsinteractive
Loading the interactive chart…
🔄Rotation against the market and its industry (RRG)interactive
Loading the interactive chart…
🔍Earnings qualityinteractive
Loading the interactive chart…
⚖️Fair value by methodinteractive
Loading the interactive chart…
🔭Outlook & guidanceinteractive
Loading the interactive chart…
📈Investments: gains and what it boughtinteractive
Loading the interactive chart…
🏭Its industry’s money flow (input-output)interactive
Loading the interactive chart…
About Tapestry
Tapestry, Inc. (the "Company") is a global house of iconic accessories and lifestyle brands uniting the magic of Coach and kate spade new york. Together, we stretch what’s possible – advancing brands further than they could go alone, expanding their reach to new geographies and generations. Inspired by our consumers, we create experiences and products that build lasting brand love and elevate everyday life. • Coach - Coach is a global fashion house of accessories and lifestyle collections, founded in New York City in 1941. Inspired by the vision of Expressive Luxury and the inclusive and courageous spirit of its hometown, the brand makes beautiful things, crafted to last – for you to be yourself in. Coach has built a legacy of craftsmanship and a community that champions the courage to be real.
In its own words, from its 10-K, filed Aug 13, 2026.
Tapestry against its Leather & Leather Products peers
The largest companies of the same SEC industry, each at its latest quarter. Revenue growth: +11% against the peers' median +2%. Operating margin: 22.4% against the peers' median 5.8%.
| Company | Quarter | Revenue | Y/Y | Op. margin |
|---|---|---|---|---|
| TPR Tapestry | Q1 FY27 | $1.9B | +11% | 22.4% |
| CPRI Capri Holdings | Q2 FY27 | $809M | -6% | 1.2% |
| VRA Vera Bradley | Q2 FY27 | $71.6M | +1% | 5.8% |
| TLF Tandy Leather Factory | Q2 2026 | $18.0M | +2% | 3.0% |
Source: Tapestry 10-Q on SEC EDGAR · CIK 1116132 · Leather & Leather Products
Guidance and outlook
13F: who owns TPR and who is buying
More on TPR
History
Every quarter: Q1 FY27 results · Q4 FY26 results · Q3 FY26 results · Q2 FY26 results · Q1 FY26 results · Q4 FY25 results · Q3 FY25 results