Filing Flows › Utilities › Tennessee Valley Authority (TVE)
Tennessee Valley Authority (TVE) earnings and revenue breakdown
Latest: Q3 FY26 · 10-Q filed Aug 4, 2026 · Tennessee Valley Authority (TVE) Q3 FY26 earnings results →
Q3 FY26 Revenue up 4% year over year to $3.4B · 9¢ of every $1 of revenue kept as net profit · operating margin 17.8%
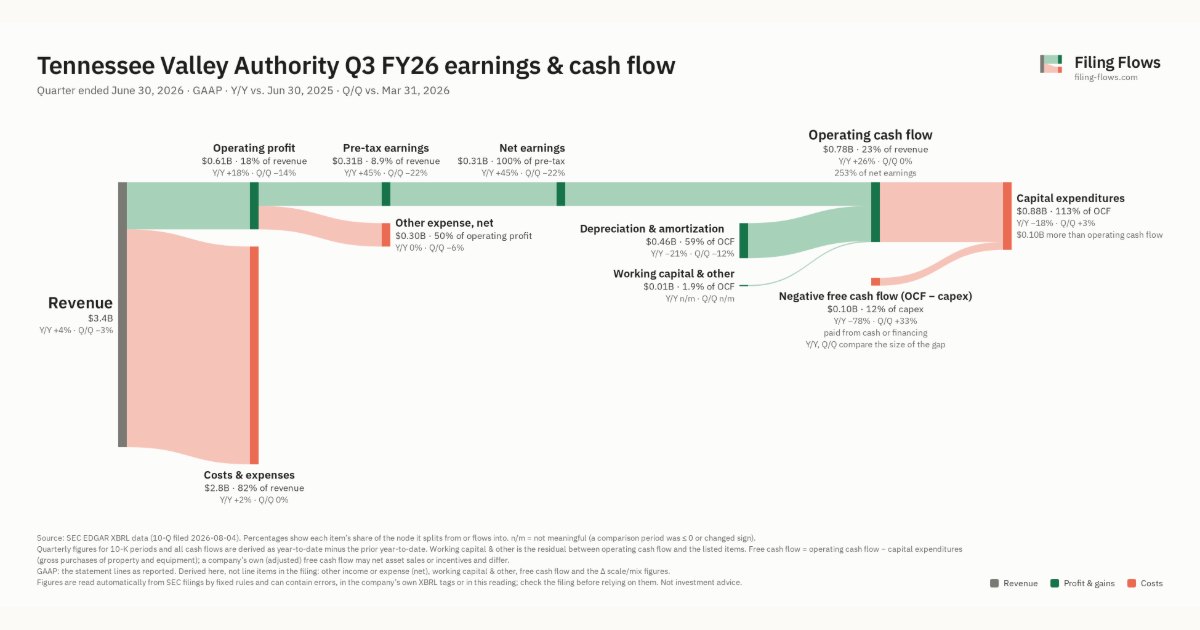
Tennessee Valley Authority made $3.4B in Q3 FY26 (+4% Y/Y). Operating margin 17.8%, net earnings $307M. See where every dollar goes — costs, profit and cash — as a Sankey from the 10-Q filed Aug 4, 2026.
Drawing the Sankey…
Open the interactive Sankey → click any line for what the company wrote about it, compare Y/Y and Q/Q, export as PNG or PDF
What changed this quarter
Revenue was $3.4B in Q3 FY26, up 4% year over year and down 3% from the previous quarter.
Operating profit was $0.61B, a 17.8% margin (up 2.1 points year over year). Of the extra revenue versus Q3 FY25, 69% reached operating profit, above the 16% margin then. Total costs grew 2% against revenue growth of 4%. Net earnings were $0.31B, up 45% year over year. The effective tax rate was 0.0%.
Operating cash flow was $0.78B (up 26% year over year), 253% of net earnings. Non-cash charges added back $0.46B of depreciation and amortization. Capital expenditures of $0.88B exceeded it, leaving free cash flow of −$0.10B.
Quarterly history
| Quarter | Form | Filed | Revenue | Y/Y | Op. margin | Net earnings | Op. cash flow |
|---|---|---|---|---|---|---|---|
| Q3 FY26 | 10-Q | Aug 4, 2026 | $3.4B | +4% | 17.8% | $307M | $777M |
| Q2 FY26 | 10-Q | May 5, 2026 | $3.5B | +0.4% | 20.1% | $392M | $776M |
| Q1 FY26 | 10-Q | Feb 3, 2026 | $3.0B | +4% | 18.1% | $266M | $330M |
| Q4 FY25 | 10-K | Nov 13, 2025 | $3.9B | +11% | 23.6% | $615M | $1.2B |
| Q3 FY25 | 10-Q | Jul 29, 2025 | $3.3B | +15% | 15.6% | $212M | $615M |
| Q2 FY25 | 10-Q | May 1, 2025 | $3.5B | +12% | 20.3% | $408M | $1.0B |
| Q4 FY24 | 10-K | Nov 14, 2024 | $3.5B | +4% | 22.7% | $520M | $1.1B |
Charts
Interactive views
The same charts as the app — open one to draw it.
💵Where each $1 goesinteractive
Loading the interactive chart…
🌏Named in Asian annual reportsinteractive
Loading the interactive chart…
🔄Rotation against the market and its industry (RRG)interactive
Loading the interactive chart…
🔍Earnings qualityinteractive
Loading the interactive chart…
⚖️Fair value by methodinteractive
Loading the interactive chart…
🔭Outlook & guidanceinteractive
Loading the interactive chart…
📈Investments: gains and what it boughtinteractive
Loading the interactive chart…
🏭Its industry’s money flow (input-output)interactive
Loading the interactive chart…
About Tennessee Valley Authority
The Tennessee Valley Authority ("TVA") is a corporate agency and instrumentality of the United States ("U.S.") that was created in 1933 by federal legislation in response to a proposal by President Franklin D. Roosevelt. TVA was created to, among other things, improve navigation on the Tennessee River, reduce the damage from destructive flood waters within the Tennessee River system and downstream on the lower Ohio and Mississippi Rivers, further the economic development of TVA's service area in the southeastern U.S., and sell the electricity generated at the facilities TVA operates. Today, TVA operates the nation's largest public power system and supplies power to a population of approximately 10 million people.
In its own words, from its 10-K, filed Nov 13, 2025.
Tennessee Valley Authority against its Electric Services peers
The largest companies of the same SEC industry, each at its latest quarter. Revenue growth: +4% against the peers' median +13%. Operating margin: 17.8% against the peers' median 26.9%.
| Company | Quarter | Revenue | Y/Y | Op. margin |
|---|---|---|---|---|
| TVE Tennessee Valley Authority | Q3 FY26 | $3.4B | +4% | 17.8% |
| Southern Power | Q3 2026 | $8.8B | +13% | 33.9% |
| NEE NextEra Energy | Q3 2026 | $8.1B | +2% | 32.4% |
| Florida Power & Light | Q2 2026 | $7.5B | +12% | 29.7% |
| CEG Constellation Energy | Q2 2026 | $7.5B | +23% | 7.7% |
| NRG NRG Energy | Q2 2026 | $7.5B | +11% | 13.0% |
| AEP Texas | Q3 2026 | $6.8B | +14% | 26.5% |
| VST Vistra | Q3 2026 | $6.3B | +28% | 26.9% |
| D Dominion Energy | Q3 2026 | $5.6B | +24% | 32.8% |
Source: Tennessee Valley Authority 10-Q on SEC EDGAR · CIK 1376986 · Electric Services
More on TVE
History
Every quarter: Q3 FY26 results · Q2 FY26 results · Q1 FY26 results · Q4 FY25 results · Q3 FY25 results · Q2 FY25 results · Q4 FY24 results