Filing Flows › Materials › Worthington Steel (WS)
Worthington Steel (WS) earnings and revenue breakdown
Latest: Q1 FY27 · 10-Q filed Oct 13, 2026 · Worthington Steel (WS) Q1 FY27 earnings results →
Q1 FY27 Revenue up 212% year over year to $2.7B · 0¢ of every $1 of revenue lost · operating margin 2.1%
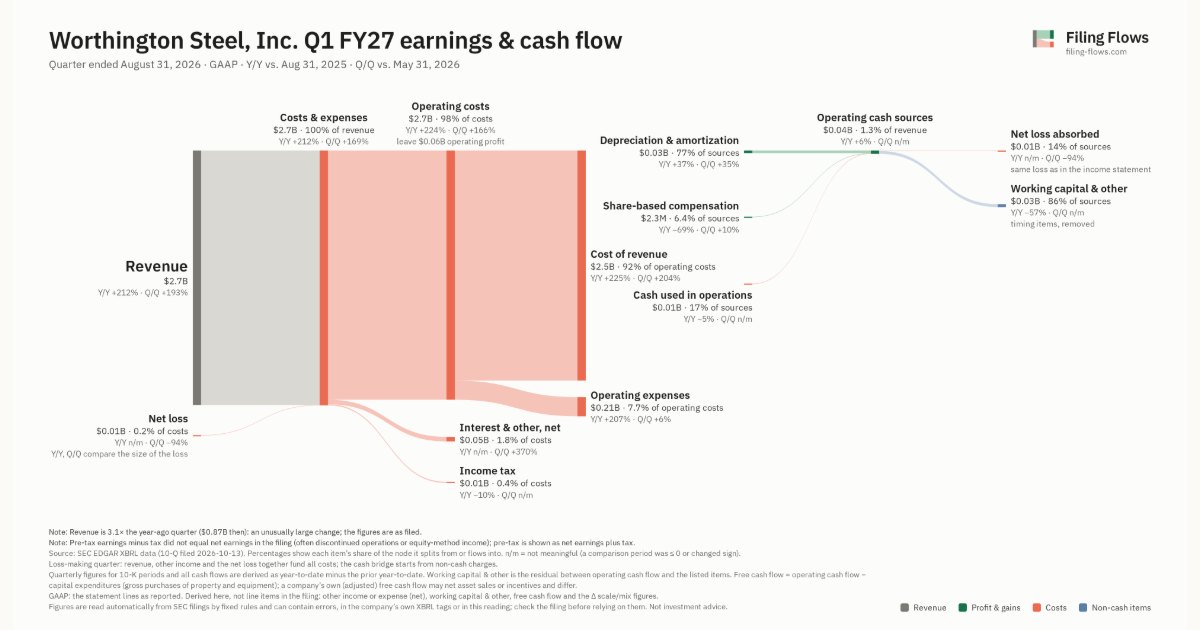
Worthington Steel made $2.7B in Q1 FY27 (+212% Y/Y). Operating margin 2.1%, net loss $5.0M. See where every dollar goes — costs, profit and cash — as a Sankey from the 10-Q filed Oct 13, 2026.
Drawing the Sankey…
Open the interactive Sankey → click any line for what the company wrote about it, compare Y/Y and Q/Q, export as PNG or PDF
What changed this quarter
Revenue was $2.7B in Q1 FY27, up 212% year over year and up 193% from the previous quarter.
Gross margin was 9.6%, down 3.6 points from Q1 FY26. Operating profit was $0.06B, a 2.1% margin (down 3.5 points year over year). Of the extra revenue versus Q1 FY26, 0% reached operating profit, below the 6% margin then. Operating expenses grew 207% against revenue growth of 212%. The quarter ended with a net loss of $0.01B, narrower than the previous quarter's $0.08B loss. Net interest and other expense of $0.05B was the main reason.
Operating cash flow was −$0.01B. Non-cash charges added back $0.03B of depreciation and amortization and $2.3M of share-based compensation. Working capital and other items used $0.03B. Capital expenditures of $0.06B exceeded it, leaving free cash flow of −$0.07B.
Quarterly history
| Quarter | Form | Filed | Revenue | Y/Y | Op. margin | Net earnings | Op. cash flow |
|---|---|---|---|---|---|---|---|
| Q1 FY27 | 10-Q | Oct 13, 2026 | $2.7B | +212% | 2.1% | −$5.0M | −$6.0M |
| Q4 FY26 | 10-K | Jul 30, 2026 | $929M | +12% | -8.0% | −$83.8M | $44.9M |
| Q3 FY26 | 10-Q | Apr 9, 2026 | $770M | +12% | 0.4% | $10.4M | $63.3M |
| Q2 FY26 | 10-Q | Jan 8, 2026 | $872M | +18% | 2.5% | $18.8M | $99.3M |
| Q1 FY26 | 10-Q | Oct 10, 2025 | $873M | +5% | 5.5% | $36.8M | −$6.3M |
| Q4 FY25 | 10-K | Jul 29, 2025 | $833M | -9% | 8.0% | $55.7M | $53.9M |
| Q3 FY25 | 10-Q | Apr 11, 2025 | $687M | -15% | 2.7% | $13.8M | $53.8M |
Charts
Interactive views
The same charts as the app — open one to draw it.
💵Where each $1 goesinteractive
Loading the interactive chart…
🌏Named in Asian annual reportsinteractive
Loading the interactive chart…
🔄Rotation against the market and its industry (RRG)interactive
Loading the interactive chart…
🔍Earnings qualityinteractive
Loading the interactive chart…
⚖️Fair value by methodinteractive
Loading the interactive chart…
🔭Outlook & guidanceinteractive
Loading the interactive chart…
📈Investments: gains and what it boughtinteractive
Loading the interactive chart…
🏭Its industry’s money flow (input-output)interactive
Loading the interactive chart…
Customers and suppliers named in filings
Sells to
Buys from
About Worthington Steel
Worthington Steel, Inc., an Ohio corporation (“Worthington Steel” and, together with its consolidated subsidiaries and joint ventures, referred to herein as the “Company,” “we,” “us” or “our”) is one of North America’s premier value-added metals processors with the ability to provide a diversified range of products and services that span a variety of end markets. We are a value-added processor of carbon flat-rolled steel and a producer of laser welded solutions and electrical steel laminations. We are one of the largest independent intermediate processors of carbon flat-rolled steel in the U.S. We occupy a niche in the steel industry by focusing on products requiring exact specifications.
In its own words, from its 10-K, filed Jul 30, 2026.
Worthington Steel against its Steel Works, Blast Furnaces & Rolling & Finishing Mills peers
The largest companies of the same SEC industry, each at its latest quarter. Revenue growth: +212% against the peers' median +54%. Operating margin: 2.1% against the peers' median 4.9%.
| Company | Quarter | Revenue | Y/Y | Op. margin |
|---|---|---|---|---|
| WS Worthington Steel | Q1 FY27 | $2.7B | +212% | 2.1% |
| ROCK Gibraltar Industries | Q3 2026 | $480M | +54% | 10.3% |
| WOR Worthington Enterprises | Q1 FY27 | $344M | +13% | 3.8% |
| FRD Friedman Industries | Q2 FY27 | $287M | +88% | 12.8% |
| IIIN Insteel Industries | Q4 FY26 | $209M | +18% | 4.9% |
Source: Worthington Steel 10-Q on SEC EDGAR · CIK 1968487 · Steel Works, Blast Furnaces & Rolling & Finishing Mills
13F: who owns WS and who is buying
More on WS
History
Every quarter: Q1 FY27 results · Q4 FY26 results · Q3 FY26 results · Q2 FY26 results · Q1 FY26 results · Q4 FY25 results · Q3 FY25 results