Filing Flows › Technology › Zoom Communications (ZM)
Zoom Communications (ZM) earnings and revenue breakdown
Latest: Q2 FY27 · 10-Q filed Aug 26, 2026 · Zoom Communications (ZM) Q2 FY27 earnings results →
Q2 FY27 Revenue up 5% year over year to $1.3B · 121¢ of every $1 of revenue kept as net profit · operating margin 24.6%
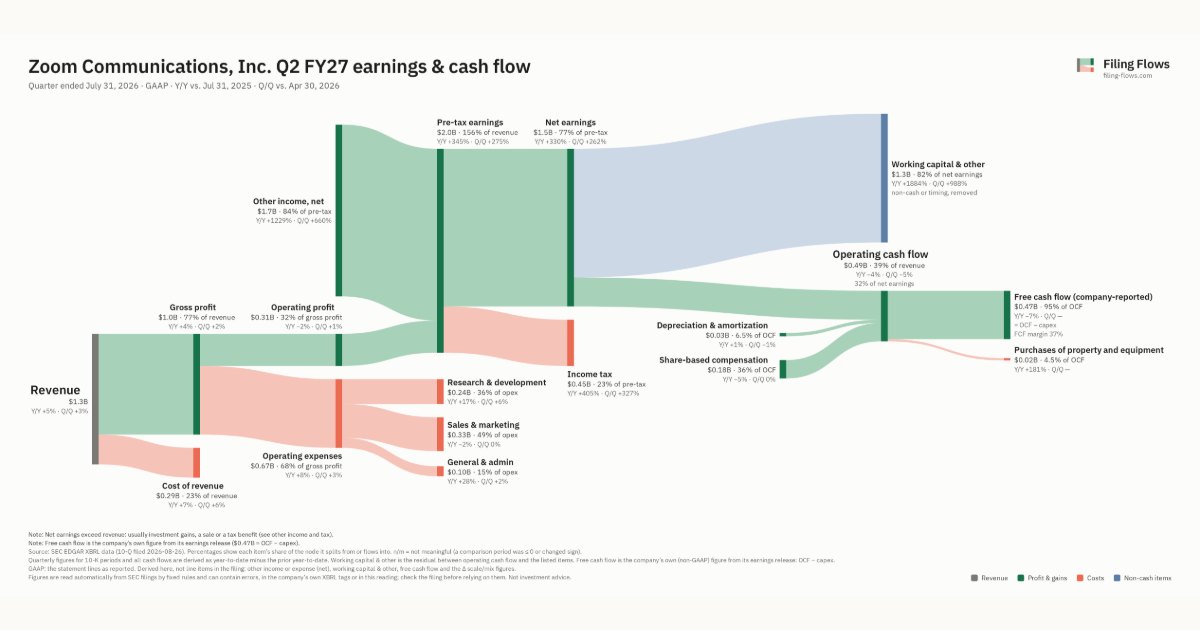
Zoom Communications made $1.3B in Q2 FY27 (+5% Y/Y). Operating margin 24.6%, net earnings $1.5B. See where every dollar goes — costs, profit and cash — as a Sankey from the 10-Q filed Aug 26, 2026.
Drawing the Sankey…
Open the interactive Sankey → click any line for what the company wrote about it, compare Y/Y and Q/Q, export as PNG or PDF
What changed this quarter
Revenue was $1.3B in Q2 FY27, up 5% year over year and up 3% from the previous quarter.
Gross margin was 77.2%, down 0.4 points from Q2 FY26. Operating profit was $0.31B, a 24.6% margin (down 1.8 points year over year). Operating profit fell $0.01B even though revenue rose $0.06B versus Q2 FY26, so costs grew faster than sales. Operating expenses grew 8% against revenue growth of 5%. The fastest-growing cost line was General & admin (+28%). Net earnings were $1.5B, up 330% year over year. The effective tax rate was 22.7%. Non-operating items added $1.7B, 84% of pre-tax earnings, so the bottom line overstates operating performance.
Operating cash flow was $0.49B (down 4% year over year), 32% of net earnings. Non-cash charges added back $0.03B of depreciation and amortization and $0.18B of share-based compensation. Working capital and other items used $1.3B. After purchases of property and equipment ($0.02B), free cash flow as the company reports it was $0.47B.
Quarterly history
| Quarter | Form | Filed | Revenue | Y/Y | Op. margin | Net earnings | Op. cash flow |
|---|---|---|---|---|---|---|---|
| Q2 FY27 | 10-Q | Aug 26, 2026 | $1.3B | +5% | 24.6% | $1.5B | $495M |
| Q1 FY27 | 10-Q | May 22, 2026 | $1.2B | +6% | 25.1% | $426M | $522M |
| Q4 FY26 | 10-K | Feb 27, 2026 | $1.2B | +5% | 20.0% | $674M | $355M |
| Q3 FY26 | 10-Q | Nov 25, 2025 | $1.2B | +4% | 25.2% | $613M | $629M |
| Q2 FY26 | 10-Q | Aug 22, 2025 | $1.2B | +5% | 26.4% | $359M | $516M |
| Q1 FY26 | 10-Q | May 23, 2025 | $1.2B | +3% | 20.6% | $255M | $489M |
| Q4 FY25 | 10-K | Feb 28, 2025 | $1.2B | +3% | 19.0% | $368M | $425M |
Charts
Interactive views
The same charts as the app — open one to draw it.
💵Where each $1 goesinteractive
Loading the interactive chart…
🌏Named in Asian annual reportsinteractive
Loading the interactive chart…
🔄Rotation against the market and its industry (RRG)interactive
Loading the interactive chart…
🔍Earnings qualityinteractive
Loading the interactive chart…
⚖️Fair value by methodinteractive
Loading the interactive chart…
🔭Outlook & guidanceinteractive
Loading the interactive chart…
📈Investments: gains and what it boughtinteractive
Loading the interactive chart…
🏭Its industry’s money flow (input-output)interactive
Loading the interactive chart…
About Zoom Communications
Zoom is redefining modern work as a system of action, turning live collaboration into completed results. From entrepreneurs to global enterprises, customers choose Zoom to seamlessly collaborate, communicate, and drive outcomes across meetings, chat, phone, contact center, events, and more — all with the built-in assistance of Zoom AI Companion. Our mission to deliver happiness, grounded in our core value of care, is fundamental to everything we do at Zoom. Our platform bridges work both inside and outside the organization by integrating AI capabilities across employee collaboration and customer-facing workflows, enabling seamless communication, collaboration, and engagement through Zoom Workplace and Zoom Business Services.
In its own words, from its 10-K, filed Feb 27, 2026.
Zoom Communications against its Services-Computer Programming, Data Processing, Etc. peers
The largest companies of the same SEC industry, each at its latest quarter. Revenue growth: +5% against the peers' median +14%. Operating margin: 24.6% against the peers' median 19.1%.
| Company | Quarter | Revenue | Y/Y | Op. margin |
|---|---|---|---|---|
| ZM Zoom Communications | Q2 FY27 | $1.3B | +5% | 24.6% |
| GOOGL Alphabet | Q3 2026 | $127.6B | +25% | 31.8% |
| META Meta Platforms | Q3 2026 | $64.6B | +26% | 20.1% |
| SPCX Space Exploration Technologies | Q3 2026 | $14.6B | +161% | 19.1% |
| FLUT Flutter Entertainment | Q3 2026 | $3.9B | +2% | -30.7% |
| APP AppLovin | Q3 2026 | $2.2B | +56% | 78.2% |
| SNAP Snap | Q3 2026 | $1.7B | +14% | 4.5% |
| PINS Pinterest | Q3 2026 | $1.2B | +12% | 2.6% |
| NIQ NIQ Global Intelligence | Q2 2026 | $1.1B | +8% | 5.8% |
Source: Zoom Communications 10-Q on SEC EDGAR · CIK 1585521 · Services-Computer Programming, Data Processing, Etc.
Guidance and outlook
13F: who owns ZM and who is buying
More on ZM
- How Zoom Communications makes money: revenue by segment
- Zoom Communications next earnings date and what analysts expect
- Zoom Communications stock forecast, price target and fair value
- Who owns Zoom Communications stock: holders, funds and Congress trades
- Is Zoom Communications a takeover target? LBO and rumors
History
Every quarter: Q2 FY27 results · Q1 FY27 results · Q4 FY26 results · Q3 FY26 results · Q2 FY26 results · Q1 FY26 results · Q4 FY25 results
- Zoom Communications guidance history: guided vs reported
- Zoom Communications gross margin by quarter
- Zoom Communications operating margin by quarter
- Zoom Communications net income by quarter
- Zoom Communications free cash flow by quarter
- Zoom Communications R&D spending by quarter
- Zoom Communications capital expenditures by quarter