Filing Flows › Technology › Snap (SNAP)
Snap (SNAP) earnings and revenue breakdown
Latest: Q3 2026 · 10-Q filed Nov 5, 2026 · Snap (SNAP) Q3 2026 earnings results →
Q3 2026 Revenue up 14% year over year to $1.7B · 3¢ of every $1 of revenue kept as net profit · operating margin 4.5%
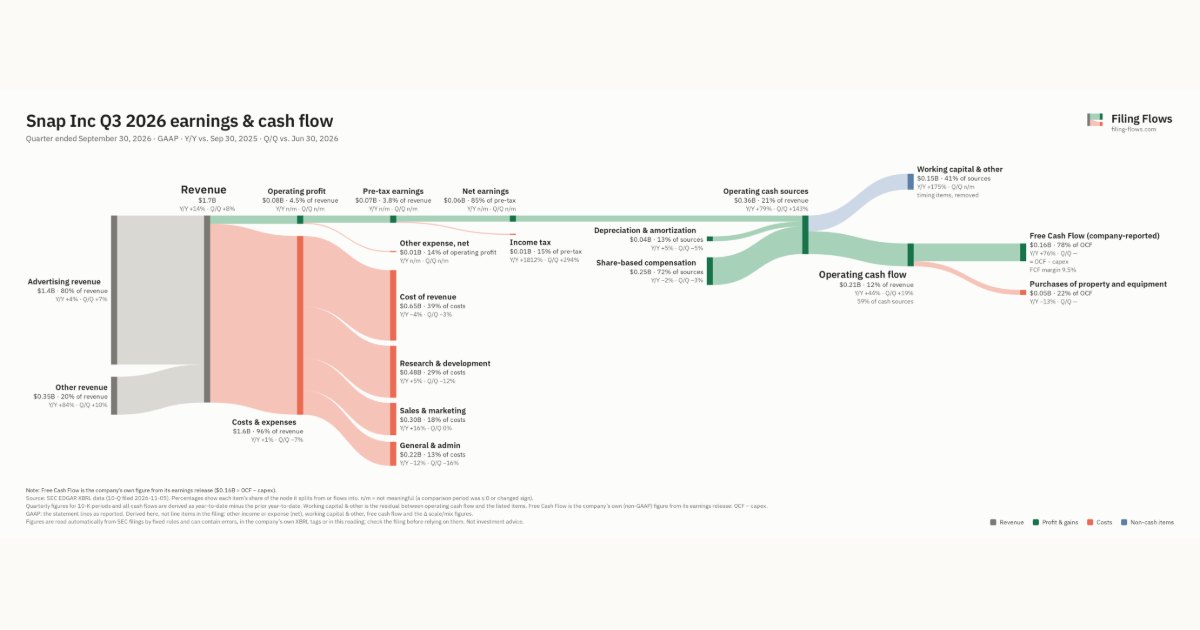
Snap made $1.7B in Q3 2026 (+14% Y/Y): Advertising revenue $1.4B, Other revenue $350M. Operating margin 4.5%, net earnings $56.5M. See where every dollar goes — costs, profit and cash — as a Sankey from the 10-Q filed Nov 5, 2026.
Drawing the Sankey…
Open the interactive Sankey → click any line for what the company wrote about it, compare Y/Y and Q/Q, export as PNG or PDF
What changed this quarter
Revenue was $1.7B in Q3 2026, up 14% year over year and up 8% from the previous quarter. Advertising revenue was the largest line at 80% of revenue. Other revenue added $0.16B year over year (up 84%), 74% of the total change.
Operating profit was $0.08B, a 4.5% margin (up 13.0 points year over year). Total costs grew 1% against revenue growth of 14%. The fastest-growing cost line was Sales & marketing (+16%). Net earnings were $0.06B. The effective tax rate was 14.7%.
Operating cash flow was $0.21B (up 44% year over year), 373% of net earnings. Non-cash charges added back $0.04B of depreciation and amortization and $0.25B of share-based compensation. Working capital and other items used $0.15B. After purchases of property and equipment ($0.05B), free cash flow as the company reports it was $0.16B.
Quarterly history
| Quarter | Form | Filed | Revenue | Y/Y | Op. margin | Net earnings | Op. cash flow |
|---|---|---|---|---|---|---|---|
| Q3 2026 | 10-Q | Nov 5, 2026 | $1.7B | +14% | 4.5% | $56.5M | $210M |
| Q2 2026 | 10-Q | Aug 4, 2026 | $1.6B | +19% | -10.7% | −$164M | $176M |
| Q1 2026 | 10-Q | May 7, 2026 | $1.5B | +12% | -4.9% | −$89.0M | $327M |
| Q4 2025 | 10-K | Feb 5, 2026 | $1.7B | +10% | 2.9% | $45.2M | $270M |
| Q3 2025 | 10-Q | Nov 6, 2025 | $1.5B | +10% | -8.5% | −$104M | $146M |
| Q2 2025 | 10-Q | Aug 6, 2025 | $1.3B | +9% | -19.3% | −$263M | $88.5M |
| Q1 2025 | 10-Q | Apr 30, 2025 | $1.4B | +14% | -14.2% | −$140M | $152M |
Charts
Interactive views
The same charts as the app — open one to draw it.
💵Where each $1 goesinteractive
Loading the interactive chart…
🌏Named in Asian annual reportsinteractive
Loading the interactive chart…
🔄Rotation against the market and its industry (RRG)interactive
Loading the interactive chart…
🔍Earnings qualityinteractive
Loading the interactive chart…
⚖️Fair value by methodinteractive
Loading the interactive chart…
🔭Outlook & guidanceinteractive
Loading the interactive chart…
📈Investments: gains and what it boughtinteractive
Loading the interactive chart…
🏭Its industry’s money flow (input-output)interactive
Loading the interactive chart…
Customers and suppliers named in filings
Buys from
- AAPL · Stated in 10-K (named, share not stated) · source
- AMZN · Stated in 10-K (named, share not stated) · source
- GOOGL · Stated in 10-K (named, share not stated) · source
About Snap
Snap Inc. is a technology company. We believe the camera presents the greatest opportunity to improve the way people live and communicate. We contribute to human progress by empowering people to express themselves, live in the moment, learn about the world, and have fun together. Our flagship product, Snapchat, is a visual messaging application that enhances your relationships with friends, family, and the world. Visual messaging is a fast, fun way to communicate with friends and family using augmented reality, video, voice, messaging, and creative tools. Snaps are deleted by default to mimic real-life conversations, so there is less pressure to look popular or perfect when creating and sending images on Snapchat. By reducing the friction typically associated with creating and sharing content, Snapchat has become one of the most used cameras in the world.
In its own words, from its 10-K, filed Feb 5, 2026.
Snap against its Services-Computer Programming, Data Processing, Etc. peers
The largest companies of the same SEC industry, each at its latest quarter. Revenue growth: +14% against the peers' median +14%. Operating margin: 4.5% against the peers' median 19.1%.
| Company | Quarter | Revenue | Y/Y | Op. margin |
|---|---|---|---|---|
| SNAP Snap | Q3 2026 | $1.7B | +14% | 4.5% |
| GOOGL Alphabet | Q3 2026 | $127.6B | +25% | 31.8% |
| META Meta Platforms | Q3 2026 | $64.6B | +26% | 20.1% |
| SPCX Space Exploration Technologies | Q3 2026 | $14.6B | +161% | 19.1% |
| FLUT Flutter Entertainment | Q3 2026 | $3.9B | +2% | -30.7% |
| APP AppLovin | Q3 2026 | $2.2B | +56% | 78.2% |
| ZM Zoom Communications | Q2 FY27 | $1.3B | +5% | 24.6% |
| PINS Pinterest | Q3 2026 | $1.2B | +12% | 2.6% |
| NIQ NIQ Global Intelligence | Q2 2026 | $1.1B | +8% | 5.8% |
Source: Snap 10-Q on SEC EDGAR · CIK 1564408 · Services-Computer Programming, Data Processing, Etc.
Guidance and outlook
13F: who owns SNAP and who is buying
More on SNAP
History
Every quarter: Q3 2026 results · Q2 2026 results · Q1 2026 results · Q4 2025 results · Q3 2025 results · Q2 2025 results · Q1 2025 results