Filing Flows › Industrials › Agco (AGCO)
Agco (AGCO) earnings and revenue breakdown
Latest: Q3 2026 · 10-Q filed Oct 29, 2026 · Agco (AGCO) Q3 2026 earnings results →
Q3 2026 Revenue down 9% year over year to $2.3B · 2¢ of every $1 of revenue kept as net profit · operating margin 5.1%
Agco made $2.3B in Q3 2026 (-9% Y/Y): Europe/Middle East $1.3B, North America $485M, Latin America $292M. Operating margin 5.1%, net earnings $51.7M. See where every dollar goes — costs, profit and cash — as a Sankey from the 10-Q filed Oct 29, 2026.
Drawing the Sankey…
Open the interactive Sankey → click any line for what the company wrote about it, compare Y/Y and Q/Q, export as PNG or PDF
What changed this quarter
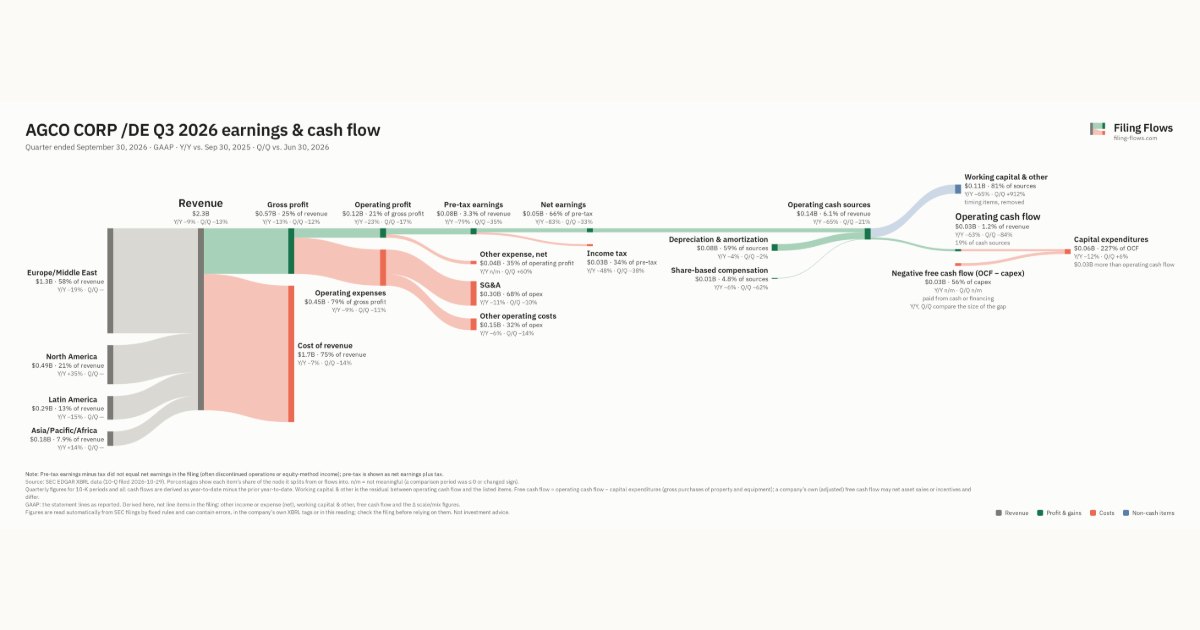
Revenue was $2.3B in Q3 2026, down 9% year over year and down 13% from the previous quarter. Europe/Middle East was the largest line at 58% of revenue. Europe/Middle East lost $0.31B year over year (down 19%), 144% of the total change.
Gross margin was 25.0%, down 1.1 points from Q3 2025. Operating profit was $0.12B, a 5.1% margin (down 1.0 points year over year). Operating expenses fell 9% while revenue fell 9%. Net earnings were $0.05B, down 83% year over year. The effective tax rate was 33.5%.
Operating cash flow was $0.03B (down 63% year over year), 53% of net income including minority interests. Non-cash charges added back $0.08B of depreciation and amortization and $0.01B of share-based compensation. Working capital and other items used $0.11B. Capital expenditures of $0.06B exceeded it, leaving free cash flow of −$0.03B.
Quarterly history
| Quarter | Form | Filed | Revenue | Y/Y | Op. margin | Net earnings | Op. cash flow |
|---|---|---|---|---|---|---|---|
| Q3 2026 | 10-Q | Oct 29, 2026 | $2.3B | -9% | 5.1% | $51.7M | $26.6M |
| Q2 2026 | 10-Q | Jul 30, 2026 | $2.6B | -1% | 5.4% | $77.2M | $165M |
| Q1 2026 | 10-Q | May 5, 2026 | $2.3B | +14% | 3.4% | $55.0M | −$410M |
| Q4 2025 | 10-K | Feb 13, 2026 | $2.9B | +1% | 7.9% | $95.5M | $764M |
| Q3 2025 | 10-Q | Oct 31, 2025 | $2.5B | -5% | 6.1% | $306M | $71.0M |
| Q2 2025 | 10-Q | Jul 31, 2025 | $2.6B | -19% | 6.2% | $314M | $366M |
| Q1 2025 | 10-Q | May 1, 2025 | $2.1B | -30% | 2.4% | $10.5M | −$212M |
Charts
Interactive views
The same charts as the app — open one to draw it.
💵Where each $1 goesinteractive
Loading the interactive chart…
🌏Named in Asian annual reportsinteractive
Loading the interactive chart…
🔄Rotation against the market and its industry (RRG)interactive
Loading the interactive chart…
🔍Earnings qualityinteractive
Loading the interactive chart…
⚖️Fair value by methodinteractive
Loading the interactive chart…
🔭Outlook & guidanceinteractive
Loading the interactive chart…
📈Investments: gains and what it boughtinteractive
Loading the interactive chart…
🏭Its industry’s money flow (input-output)interactive
Loading the interactive chart…
About Agco
AGCO Corporation was incorporated in Delaware in 1991. Unless otherwise indicated, all references in this Form 10-K to “AGCO,” “we,” “us” or the “Company” include AGCO Corporation and its subsidiaries. AGCO is a global leader in agricultural machinery and precision agriculture technologies. Driven by a Farmer-First strategy, AGCO delivers value through its differentiated leading brands, Fendt ™ , Massey Ferguson ™ , PTx ™ and Valtra ™ . AGCO’s high-performance equipment and smart farming solutions, including brand-agnostic retrofit technologies and autonomous offerings, empower farmers to drive productivity while sustainably feeding the world. We distribute most of our products through approximately 2,800 independent dealers and distributors in approximately 140 countries.
In its own words, from its 10-K, filed Feb 13, 2026.
Agco against its Farm Machinery & Equipment peers
The largest companies of the same SEC industry, each at its latest quarter. Revenue growth: -9% against the peers' median -4%. Operating margin: 5.1% against the peers' median 5.1%.
| Company | Quarter | Revenue | Y/Y | Op. margin |
|---|---|---|---|---|
| AGCO Agco | Q3 2026 | $2.3B | -9% | 5.1% |
| DE Deere | Q3 FY26 | $12.6B | +5% | 14.9% |
| ALG Alamo Group | Q3 2026 | $403M | -4% | 0.9% |
| LNN Lindsay | Q4 FY26 | $162M | +5% | 9.8% |
| ARTW Arts Way Manufacturing | Q3 FY26 | $5.6M | -13% | -1.2% |
Source: Agco 10-Q on SEC EDGAR · CIK 880266 · Farm Machinery & Equipment
13F: who owns AGCO and who is buying
More on AGCO
History
Every quarter: Q3 2026 results · Q2 2026 results · Q1 2026 results · Q4 2025 results · Q3 2025 results · Q2 2025 results · Q1 2025 results