Filing Flows › Health Care › Alnylam Pharmaceuticals (ALNY)
Alnylam Pharmaceuticals (ALNY) earnings and revenue breakdown
Latest: Q3 2026 · 10-Q filed Oct 29, 2026 · Alnylam Pharmaceuticals (ALNY) Q3 2026 earnings results →
Q3 2026 Revenue up 17% year over year to $1.5B · 149¢ of every $1 of revenue kept as net profit · operating margin 23.7%
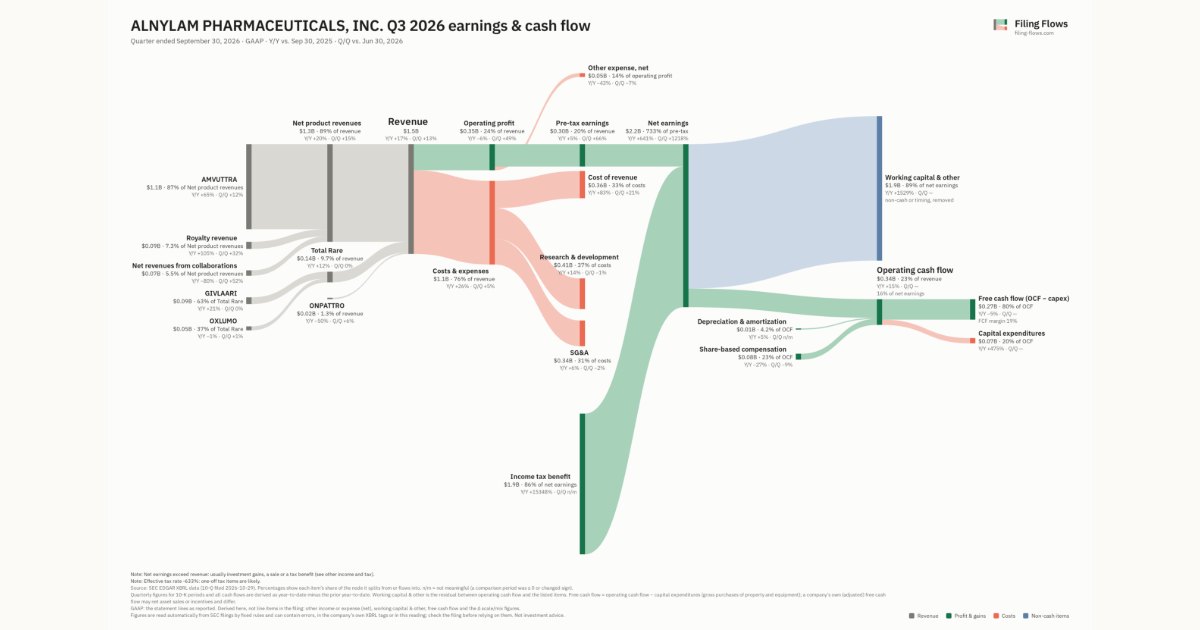
Alnylam Pharmaceuticals made $1.5B in Q3 2026 (+17% Y/Y): Net product revenues $1.3B, Total Rare $142M, ONPATTRO $19.6M. Operating margin 23.7%, net earnings $2.2B. See where every dollar goes — costs, profit and cash — as a Sankey from the 10-Q filed Oct 29, 2026.
Drawing the Sankey…
Open the interactive Sankey → click any line for what the company wrote about it, compare Y/Y and Q/Q, export as PNG or PDF
What changed this quarter
Revenue was $1.5B in Q3 2026, up 17% year over year and up 13% from the previous quarter. AMVUTTRA was the largest line at 78% of revenue. AMVUTTRA added $0.45B year over year (up 65%), 213% of the total change. Net revenues from collaborations declined 80%.
Operating profit was $0.35B, a 23.7% margin (down 5.7 points year over year). Operating profit fell $0.02B even though revenue rose $0.21B versus Q3 2025, so costs grew faster than sales. Total costs grew 26% against revenue growth of 17%. The fastest-growing cost line was Cost of revenue (+83%). Net earnings were $2.2B, up 641% year over year. The tax line was a benefit of $1.9B on pre-tax earnings of $0.30B.
Operating cash flow was $0.34B (up 15% year over year), 16% of net earnings. Non-cash charges added back $0.01B of depreciation and amortization and $0.08B of share-based compensation. Working capital and other items used $1.9B. Capital expenditures of $0.07B left free cash flow of $0.27B.
Quarterly history
| Quarter | Form | Filed | Revenue | Y/Y | Op. margin | Net earnings | Op. cash flow |
|---|---|---|---|---|---|---|---|
| Q3 2026 | 10-Q | Oct 29, 2026 | $1.5B | +17% | 23.7% | $2.2B | $341M |
| Q2 2026 | 10-Q | Jul 30, 2026 | $1.3B | +67% | 17.9% | $164M | — |
| Q4 2025 | 10-K | Feb 12, 2026 | $1.1B | +85% | 12.0% | $112M | $164M |
| Q3 2025 | 10-Q | Oct 30, 2025 | $1.2B | +149% | 29.5% | $251M | $325M |
| Q2 2025 | 10-Q | Jul 31, 2025 | $774M | +17% | -2.1% | −$66.3M | $154M |
| Q1 2025 | 10-Q | May 1, 2025 | $594M | +20% | 3.0% | −$57.5M | −$118M |
| Q4 2024 | 10-K | Feb 13, 2025 | $593M | +35% | -17.7% | −$83.8M | −$94.7M |
Charts
Interactive views
The same charts as the app — open one to draw it.
💵Where each $1 goesinteractive
Loading the interactive chart…
🌏Named in Asian annual reportsinteractive
Loading the interactive chart…
🔄Rotation against the market and its industry (RRG)interactive
Loading the interactive chart…
🔍Earnings qualityinteractive
Loading the interactive chart…
⚖️Fair value by methodinteractive
Loading the interactive chart…
🔭Outlook & guidanceinteractive
Loading the interactive chart…
📈Investments: gains and what it boughtinteractive
Loading the interactive chart…
🏭Its industry’s money flow (input-output)interactive
Loading the interactive chart…
Customers and suppliers named in filings
Sells to
- NVS — 23% of its revenue · Stated in 10-K (customer table) · source
- REGN — 11% of its revenue · Stated in 10-K (customer table) · source
- ABUS · Stated in 10-K (named, share not stated) · source
About Alnylam Pharmaceuticals
Alnylam Pharmaceuticals, Inc. (also referred to as Alnylam, the Company, we, our or us) is a global commercial-stage biopharmaceutical company developing novel therapeutics based on ribonucleic acid interference, or RNAi. RNAi is a naturally occurring biological pathway within cells for sequence-specific silencing and regulation of gene expression. By harnessing the RNAi pathway, we have pioneered a new class of innovative medicines, known as RNAi therapeutics. RNAi therapeutics are comprised of small interfering RNA, or siRNA, that function upstream of conventional medicines by potently silencing messenger RNA, or mRNA, that encode for proteins implicated in the cause or pathway of disease, thus preventing them from being made. We believe this is a revolutionary approach with the potential to transform the care of patients across a broad range of disease areas and indications.
In its own words, from its 10-K, filed Feb 12, 2026.
Alnylam Pharmaceuticals against its Pharmaceutical Preparations peers
The largest companies of the same SEC industry, each at its latest quarter. Revenue growth: +17% against the peers' median +10%. Operating margin: 23.7% against the peers' median 23.7%.
| Company | Quarter | Revenue | Y/Y | Op. margin |
|---|---|---|---|---|
| ALNY Alnylam Pharmaceuticals | Q3 2026 | $1.5B | +17% | 23.7% |
| JNJ Johnson & Johnson | Q3 2026 | $25.4B | +6% | 0.1% |
| LLY ELI Lilly | Q3 2026 | $24.4B | +39% | 34.5% |
| MRK Merck | Q3 2026 | $18.1B | +5% | 30.7% |
| ABBV AbbVie | Q3 2026 | $17.4B | +10% | 36.0% |
| PFE Pfizer | Q3 2026 | $16.6B | -0.4% | 20.4% |
| BMY Bristol Myers Squibb | Q3 2026 | $13.1B | +7% | 19.4% |
| ABT Abbott Laboratories | Q3 2026 | $13.0B | +14% | 10.4% |
| REGN Regeneron Pharmaceuticals | Q3 2026 | $5.1B | +36% | 40.0% |
Source: Alnylam Pharmaceuticals 10-Q on SEC EDGAR · CIK 1178670 · Pharmaceutical Preparations
Guidance and outlook
13F: who owns ALNY and who is buying
More on ALNY
- How Alnylam Pharmaceuticals makes money: revenue by segment
- Alnylam Pharmaceuticals next earnings date and what analysts expect
- Alnylam Pharmaceuticals stock forecast, price target and fair value
- Who owns Alnylam Pharmaceuticals stock: holders, funds and Congress trades
- Alnylam Pharmaceuticals guidance and outlook
- Is Alnylam Pharmaceuticals a takeover target? LBO and rumors
- Alnylam Pharmaceuticals recalls, complaints and regulation
History
Every quarter: Q3 2026 results · Q2 2026 results · Q4 2025 results · Q3 2025 results · Q2 2025 results · Q1 2025 results · Q4 2024 results
- Alnylam Pharmaceuticals guidance history: guided vs reported
- Alnylam Pharmaceuticals operating margin by quarter
- Alnylam Pharmaceuticals net income by quarter
- Alnylam Pharmaceuticals free cash flow by quarter
- Alnylam Pharmaceuticals R&D spending by quarter
- Alnylam Pharmaceuticals capital expenditures by quarter
- Alnylam Pharmaceuticals Net product revenues revenue by quarter
- Alnylam Pharmaceuticals ONPATTRO revenue by quarter