Filing Flows › Materials › Air Products & Chemicals (APD)
Air Products & Chemicals (APD) earnings and revenue breakdown
Latest: Q4 FY26 · 8-K filed Nov 5, 2026
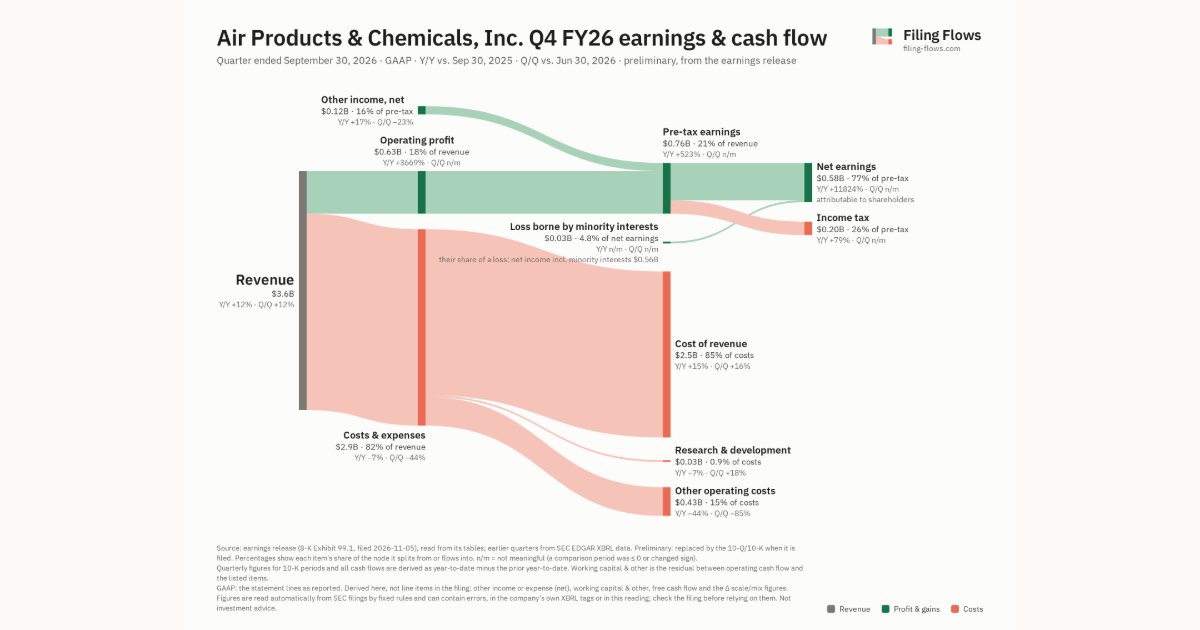
Q4 FY26 Revenue up 12% year over year to $3.6B · 16¢ of every $1 of revenue kept as net profit · operating margin 17.8%
Air Products & Chemicals made $3.6B in Q4 FY26 (+12% Y/Y). Operating margin 17.8%, net earnings $584M. See where every dollar goes — costs, profit and cash — as a Sankey from the 8-K filed Nov 5, 2026 (preliminary, from the earnings release).
Drawing the Sankey…
Open the interactive Sankey → click any line for what the company wrote about it, compare Y/Y and Q/Q, export as PNG or PDF
What changed this quarter
Revenue was $3.6B in Q4 FY26, up 12% year over year and up 12% from the previous quarter.
Operating profit was $0.63B, a 17.8% margin (up 17.3 points year over year). Of the extra revenue versus Q4 FY25, 159% reached operating profit, above the 1% margin then. Total costs fell 7% while revenue rose 12%. The fastest-growing cost line was Cost of revenue (+15%). Net earnings were $0.58B, up 11824% year over year ($0.56B including minority interests, which bore $0.03B of losses). The effective tax rate was 26.3%.
Quarterly history
| Quarter | Form | Filed | Revenue | Y/Y | Op. margin | Net earnings | Op. cash flow |
|---|---|---|---|---|---|---|---|
| Q4 FY26 | 8-K | Nov 5, 2026 | $3.6B | +12% | 17.8% | $584M | — |
| Q3 FY26 | 10-Q | Jul 30, 2026 | $3.2B | +5% | -66.3% | −$1.4B | $1.3B |
| Q2 FY26 | 10-Q | Apr 30, 2026 | $3.2B | +9% | 23.7% | $710M | $1.1B |
| Q1 FY26 | 10-Q | Jan 30, 2026 | $3.1B | +6% | 23.7% | $678M | $901M |
| Q4 FY25 | 10-K | Nov 20, 2025 | $3.2B | -0.6% | 0.5% | $4.9M | $1.3B |
| Q3 FY25 | 10-Q | Jul 31, 2025 | $3.0B | +1% | 26.2% | $714M | $856M |
| Q2 FY25 | 10-Q | May 1, 2025 | $2.9B | -0.5% | -79.8% | −$1.7B | $328M |
Charts
Interactive views
The same charts as the app — open one to draw it.
💵Where each $1 goesinteractive
Loading the interactive chart…
🌏Named in Asian annual reportsinteractive
Loading the interactive chart…
🔄Rotation against the market and its industry (RRG)interactive
Loading the interactive chart…
🔍Earnings qualityinteractive
Loading the interactive chart…
⚖️Fair value by methodinteractive
Loading the interactive chart…
🔭Outlook & guidanceinteractive
Loading the interactive chart…
📈Investments: gains and what it boughtinteractive
Loading the interactive chart…
🏭Its industry’s money flow (input-output)interactive
Loading the interactive chart…
About Air Products & Chemicals
As used in this report, unless the context indicates otherwise, the terms “we,” “our,” “us,” the “Company,” "Air Products," or “registrant” include our controlled subsidiaries and affiliates. Additional information about Air Products is available on our website at www.airproducts.com. References to our website within this report are inactive textual references only. The content of our website is not incorporated by reference into, and does not form part of, this Annual Report on Form 10-K.
In its own words, from its 10-K, filed Nov 20, 2025.
Air Products & Chemicals against its Industrial Inorganic Chemicals peers
The largest companies of the same SEC industry, each at its latest quarter. Revenue growth: +12% against the peers' median +10%. Operating margin: 17.8% against the peers' median 11.4%.
| Company | Quarter | Revenue | Y/Y | Op. margin |
|---|---|---|---|---|
| APD Air Products & Chemicals | Q4 FY26 | $3.6B | +12% | 17.8% |
| LIN Linde | Q3 2026 | $9.4B | +9% | 22.9% |
| TROX Tronox Holdings | Q3 2026 | $827M | +18% | 1.5% |
| VHI Valhi | Q3 2026 | $589M | +17% | 11.4% |
| MTX Minerals Technologies | Q3 2026 | $555M | +4% | 11.7% |
| KRO Kronos Worldwide | Q3 2026 | $541M | +18% | 10.7% |
| LXU LSB Industries | Q3 2026 | $159M | +2% | 16.9% |
| LXFR Luxfer Holdings | Q3 2026 | $91.7M | -4% | 3.1% |
| NL NLI Holdings | Q3 2026 | $44.0M | +10% | 7.1% |
Source: Air Products & Chemicals 8-K on SEC EDGAR · CIK 2969 · Industrial Inorganic Chemicals
13F: who owns APD and who is buying
More on APD
- How Air Products & Chemicals makes money: revenue by segment
- Air Products & Chemicals next earnings date and what analysts expect
- Air Products & Chemicals stock forecast, price target and fair value
- Who owns Air Products & Chemicals stock: holders, funds and Congress trades
- Air Products & Chemicals guidance and outlook
- Is Air Products & Chemicals a takeover target? LBO and rumors
- Air Products & Chemicals recalls, complaints and regulation
History
Every quarter: Q4 FY26 results · Q3 FY26 results · Q2 FY26 results · Q1 FY26 results · Q4 FY25 results · Q3 FY25 results · Q2 FY25 results