Filing Flows › Materials › Linde (LIN)
Linde (LIN) earnings and revenue breakdown
Latest: Q3 2026 · 10-Q filed Oct 29, 2026 · Linde (LIN) Q3 2026 earnings results →
Q3 2026 Revenue up 9% year over year to $9.4B · 18¢ of every $1 of revenue kept as net profit · operating margin 22.9%
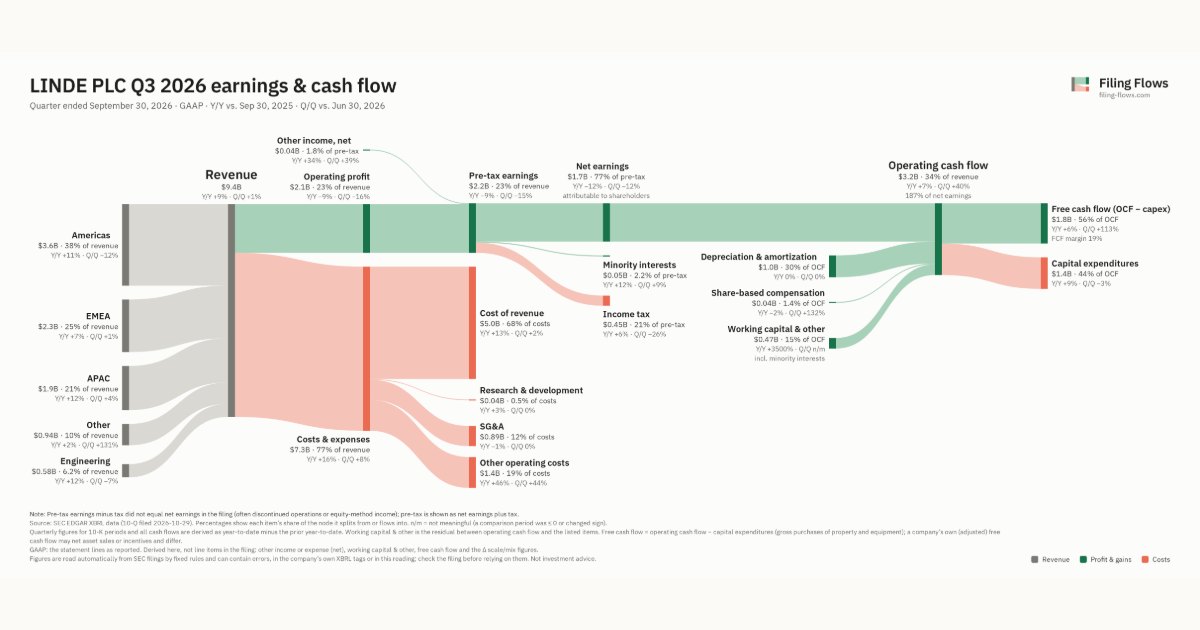
Linde made $9.4B in Q3 2026 (+9% Y/Y): Americas $3.6B, EMEA $2.3B, APAC $1.9B. Operating margin 22.9%, net earnings $1.7B. See where every dollar goes — costs, profit and cash — as a Sankey from the 10-Q filed Oct 29, 2026.
Drawing the Sankey…
Open the interactive Sankey → click any line for what the company wrote about it, compare Y/Y and Q/Q, export as PNG or PDF
What changed this quarter
Revenue was $9.4B in Q3 2026, up 9% year over year and up 1% from the previous quarter. Americas was the largest line at 38% of revenue. Americas added $0.35B year over year (up 11%), 44% of the total change.
Operating profit was $2.1B, a 22.9% margin (down 4.6 points year over year). Operating profit fell $0.22B even though revenue rose $0.79B versus Q3 2025, so costs grew faster than sales. Total costs grew 16% against revenue growth of 9%. The fastest-growing cost line was Other operating costs (+46%). Net earnings were $1.7B, down 12% year over year. The effective tax rate was 20.5%.
Operating cash flow was $3.2B (up 7% year over year), 182% of net income including minority interests. Non-cash charges added back $1.0B of depreciation and amortization and $0.04B of share-based compensation. Working capital and other items added $0.42B. Capital expenditures of $1.4B left free cash flow of $1.8B.
Quarterly history
| Quarter | Form | Filed | Revenue | Y/Y | Op. margin | Net earnings | Op. cash flow |
|---|---|---|---|---|---|---|---|
| Q3 2026 | 10-Q | Oct 29, 2026 | $9.4B | +9% | 22.9% | $1.7B | $3.2B |
| Q2 2026 | 10-Q | Jul 31, 2026 | $9.3B | +9% | 27.5% | $1.9B | $2.3B |
| Q1 2026 | 10-Q | May 1, 2026 | $8.8B | +8% | 27.8% | $1.9B | $2.2B |
| Q4 2025 | 10-K | Feb 25, 2026 | $8.8B | +6% | 23.0% | $1.5B | $3.0B |
| Q3 2025 | 10-Q | Oct 31, 2025 | $8.6B | +3% | 27.5% | $1.9B | $2.9B |
| Q2 2025 | 10-Q | Aug 1, 2025 | $8.5B | +3% | 27.7% | $1.8B | $2.2B |
| Q1 2025 | 10-Q | May 1, 2025 | $8.1B | +0.1% | 26.9% | $1.7B | $2.2B |
Charts
Interactive views
The same charts as the app — open one to draw it.
💵Where each $1 goesinteractive
Loading the interactive chart…
🌏Named in Asian annual reportsinteractive
Loading the interactive chart…
🔄Rotation against the market and its industry (RRG)interactive
Loading the interactive chart…
🔍Earnings qualityinteractive
Loading the interactive chart…
⚖️Fair value by methodinteractive
Loading the interactive chart…
🔭Outlook & guidanceinteractive
Loading the interactive chart…
📈Investments: gains and what it boughtinteractive
Loading the interactive chart…
🏭Its industry’s money flow (input-output)interactive
Loading the interactive chart…
About Linde
Linde plc is a public limited company formed under the laws of Ireland with its principal offices in the United Kingdom and United States. Linde is the largest industrial gas company worldwide and is a major technological innovator in the industrial gases industry. Its primary products in its industrial gases business are atmospheric gases (oxygen, nitrogen, argon, and rare gases) and process gases (hydrogen, helium, carbon dioxide, carbon monoxide, electronic gases, specialty gases, and acetylene). The company also designs and builds equipment that produces industrial gases and offers customers a wide range of gas production and processing services such as olefin plants, natural gas plants, air separation plants, hydrogen and synthesis gas plants, and other types of plants.
In its own words, from its 10-K, filed Feb 25, 2026.
Linde against its Industrial Inorganic Chemicals peers
The largest companies of the same SEC industry, each at its latest quarter. Revenue growth: +9% against the peers' median +10%. Operating margin: 22.9% against the peers' median 11.4%.
| Company | Quarter | Revenue | Y/Y | Op. margin |
|---|---|---|---|---|
| LIN Linde | Q3 2026 | $9.4B | +9% | 22.9% |
| APD Air Products & Chemicals | Q4 FY26 | $3.6B | +12% | 17.8% |
| TROX Tronox Holdings | Q3 2026 | $827M | +18% | 1.5% |
| VHI Valhi | Q3 2026 | $589M | +17% | 11.4% |
| MTX Minerals Technologies | Q3 2026 | $555M | +4% | 11.7% |
| KRO Kronos Worldwide | Q3 2026 | $541M | +18% | 10.7% |
| LXU LSB Industries | Q3 2026 | $159M | +2% | 16.9% |
| LXFR Luxfer Holdings | Q3 2026 | $91.7M | -4% | 3.1% |
| NL NLI Holdings | Q3 2026 | $44.0M | +10% | 7.1% |
Source: Linde 10-Q on SEC EDGAR · CIK 1707925 · Industrial Inorganic Chemicals
Guidance and outlook
More on LIN
- How Linde makes money: revenue by segment
- Linde next earnings date and what analysts expect
- Linde stock forecast, price target and fair value
- Who owns Linde stock: holders, funds and Congress trades
- Linde guidance and outlook
- Is Linde a takeover target? LBO and rumors
- Linde recalls, complaints and regulation
History
Every quarter: Q3 2026 results · Q2 2026 results · Q1 2026 results · Q4 2025 results · Q3 2025 results · Q2 2025 results · Q1 2025 results