Filing Flows › Consumer Discretionary › Academy Sports & Outdoors (ASO)
Academy Sports & Outdoors (ASO) earnings and revenue breakdown
Latest: Q2 FY27 · 10-Q filed Sep 9, 2026 · Academy Sports & Outdoors (ASO) Q2 FY27 earnings results →
Q2 FY27 Revenue up 3% year over year to $1.6B · 8¢ of every $1 of revenue kept as net profit · operating margin 15.0%
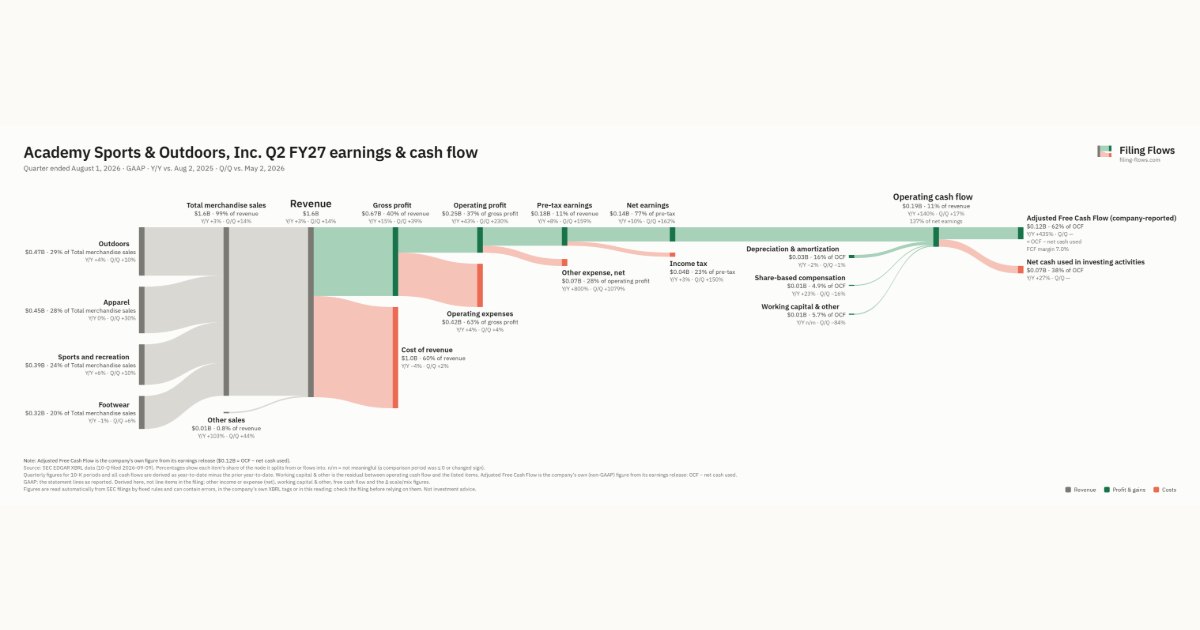
Academy Sports & Outdoors made $1.6B in Q2 FY27 (+3% Y/Y): Total merchandise sales $1.6B, Other sales $13.7M. Operating margin 15.0%, net earnings $138M. See where every dollar goes — costs, profit and cash — as a Sankey from the 10-Q filed Sep 9, 2026.
Drawing the Sankey…
Open the interactive Sankey → click any line for what the company wrote about it, compare Y/Y and Q/Q, export as PNG or PDF
What changed this quarter
Revenue was $1.6B in Q2 FY27, up 3% year over year and up 14% from the previous quarter. Outdoors was the largest line at 28% of revenue. Sports and recreation added $0.02B year over year (up 6%), 49% of the total change. Footwear declined 1%.
Gross margin was 40.4%, up 4.4 points from Q2 FY26. Operating profit was $0.25B, a 15.0% margin (up 4.2 points year over year). Of the extra revenue versus Q2 FY26, 156% reached operating profit, above the 11% margin then. Operating expenses grew 4% against revenue growth of 3%. Net earnings were $0.14B, up 10% year over year. The effective tax rate was 22.7%.
Operating cash flow was $0.19B (up 140% year over year), 137% of net earnings. Non-cash charges added back $0.03B of depreciation and amortization and $0.01B of share-based compensation. Working capital and other items added $0.01B. After net cash used in investing activities ($0.07B), adjusted free cash flow as the company reports it was $0.12B.
Quarterly history
| Quarter | Form | Filed | Revenue | Y/Y | Op. margin | Net earnings | Op. cash flow |
|---|---|---|---|---|---|---|---|
| Q2 FY27 | 10-Q | Sep 9, 2026 | $1.6B | +3% | 15.0% | $138M | $188M |
| Q1 FY27 | 10-Q | Jun 10, 2026 | $1.4B | +7% | 5.2% | $52.7M | $161M |
| Q4 FY26 | 10-K | Mar 17, 2026 | $1.7B | +2% | 9.9% | $134M | $150M |
| Q3 FY26 | 10-Q | Dec 9, 2025 | $1.4B | +3% | 7.3% | $71.6M | $49.0M |
| Q2 FY26 | 10-Q | Sep 2, 2025 | $1.6B | +3% | 10.8% | $125M | $78.6M |
| Q1 FY26 | 10-Q | Jun 10, 2025 | $1.4B | -0.9% | 5.1% | $46.1M | $157M |
| Q4 FY25 | 10-K | Mar 20, 2025 | $1.7B | -7% | 9.2% | $134M | $140M |
Charts
Interactive views
The same charts as the app — open one to draw it.
💵Where each $1 goesinteractive
Loading the interactive chart…
🌏Named in Asian annual reportsinteractive
Loading the interactive chart…
🔄Rotation against the market and its industry (RRG)interactive
Loading the interactive chart…
🔍Earnings qualityinteractive
Loading the interactive chart…
⚖️Fair value by methodinteractive
Loading the interactive chart…
🔭Outlook & guidanceinteractive
Loading the interactive chart…
📈Investments: gains and what it boughtinteractive
Loading the interactive chart…
🏭Its industry’s money flow (input-output)interactive
Loading the interactive chart…
About Academy Sports & Outdoors
The following discussion and analysis of our financial condition and results of operations should be read together with our financial statements and related notes included elsewhere in this Annual Report for the fiscal year ended January 31, 2026. This discussion contains forward-looking statements that involve risks and uncertainties. See the section of this Annual Report entitled “Cautionary Statement Regarding Forward-Looking Statements.” When reviewing the discussion below, you should keep in mind the substantial risks and uncertainties that characterize our business.
In its own words, from its 10-K, filed Mar 17, 2026.
Academy Sports & Outdoors against its Retail-Miscellaneous Shopping Goods Stores peers
The largest companies of the same SEC industry, each at its latest quarter. Revenue growth: +3% against the peers' median +3%. Operating margin: 15.0% against the peers' median -0.4%.
| Company | Quarter | Revenue | Y/Y | Op. margin |
|---|---|---|---|---|
| ASO Academy Sports & Outdoors | Q2 FY27 | $1.6B | +3% | 15.0% |
| DKS Dick's Sporting Goods | Q2 FY27 | $5.6B | +53% | 7.9% |
| SPWH Sportsman's Warehouse Holdings | Q2 FY27 | $296M | +0.6% | -0.4% |
| BNED Barnes & Noble Education | Q1 FY27 | $291M | +0.8% | -5.9% |
| PEW GrabAGun Digital Holdings | Q2 2026 | $23.2M | +9% | -11.1% |
| KCRD Kindcard | Q2 FY27 | $73K | -20% | -74.5% |
Source: Academy Sports & Outdoors 10-Q on SEC EDGAR · CIK 1817358 · Retail-Miscellaneous Shopping Goods Stores
13F: who owns ASO and who is buying
More on ASO
History
Every quarter: Q2 FY27 results · Q1 FY27 results · Q4 FY26 results · Q3 FY26 results · Q2 FY26 results · Q1 FY26 results · Q4 FY25 results
- Academy Sports & Outdoors gross margin by quarter
- Academy Sports & Outdoors operating margin by quarter
- Academy Sports & Outdoors net income by quarter
- Academy Sports & Outdoors free cash flow by quarter
- Academy Sports & Outdoors capital expenditures by quarter
- Academy Sports & Outdoors Total merchandise sales revenue by quarter
- Academy Sports & Outdoors Other sales revenue by quarter