Filing Flows › Consumer Discretionary › Dick's Sporting Goods (DKS)
Dick's Sporting Goods (DKS) earnings and revenue breakdown
Latest: Q2 FY27 · 10-Q filed Sep 3, 2026 · Dick's Sporting Goods (DKS) Q2 FY27 earnings results →
Q2 FY27 Revenue up 53% year over year to $5.6B · 6¢ of every $1 of revenue kept as net profit · operating margin 7.9%
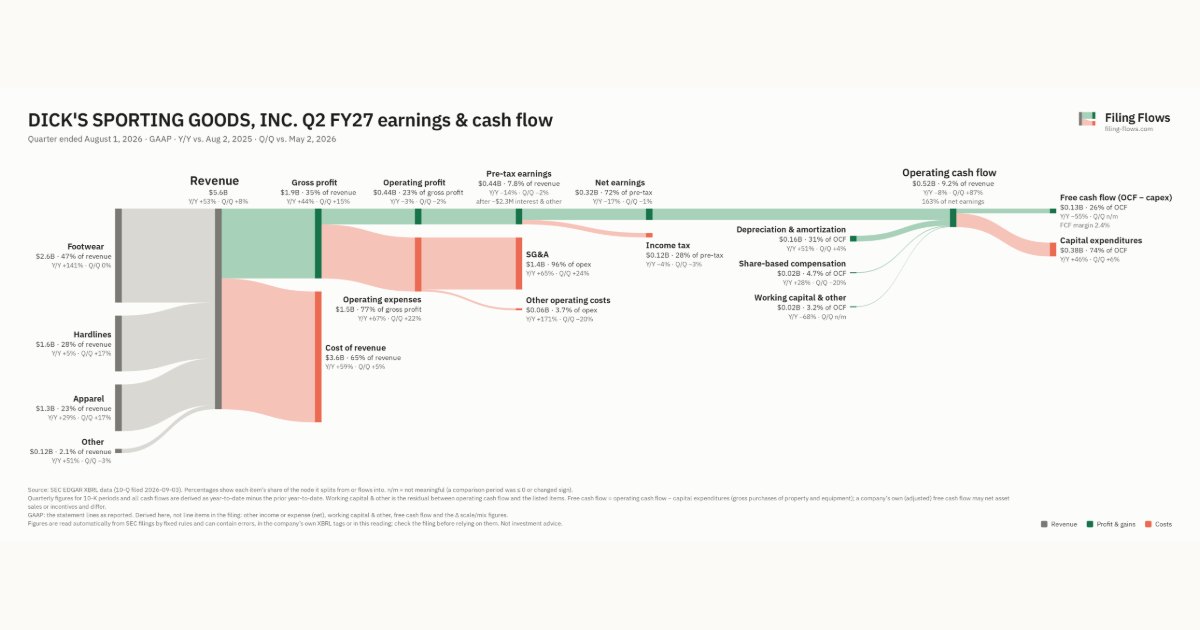
Dick's Sporting Goods made $5.6B in Q2 FY27 (+53% Y/Y): Footwear $2.6B, Hardlines $1.6B, Apparel $1.3B. Operating margin 7.9%, net earnings $315M. See where every dollar goes — costs, profit and cash — as a Sankey from the 10-Q filed Sep 3, 2026.
Drawing the Sankey…
Open the interactive Sankey → click any line for what the company wrote about it, compare Y/Y and Q/Q, export as PNG or PDF
What changed this quarter
Revenue was $5.6B in Q2 FY27, up 53% year over year and up 8% from the previous quarter. Footwear was the largest line at 47% of revenue. Footwear added $1.5B year over year (up 141%), 79% of the total change.
Gross margin was 34.8%, down 2.3 points from Q2 FY26. Operating profit was $0.44B, a 7.9% margin (down 4.5 points year over year). Operating profit fell $0.01B even though revenue rose $1.9B versus Q2 FY26, so costs grew faster than sales. Operating expenses grew 67% against revenue growth of 53%. The fastest-growing cost line was Other operating costs (+171%). Net earnings were $0.32B, down 17% year over year. The effective tax rate was 28.0%.
Operating cash flow was $0.52B (down 8% year over year), 163% of net earnings. Non-cash charges added back $0.16B of depreciation and amortization and $0.02B of share-based compensation. Capital expenditures of $0.38B left free cash flow of $0.13B.
Quarterly history
| Quarter | Form | Filed | Revenue | Y/Y | Op. margin | Net earnings | Op. cash flow |
|---|---|---|---|---|---|---|---|
| Q2 FY27 | 10-Q | Sep 3, 2026 | $5.6B | +53% | 7.9% | $315M | $516M |
| Q1 FY27 | 10-Q | Jun 4, 2026 | $5.2B | +63% | 8.7% | $320M | $277M |
| Q4 FY26 | 10-K | Mar 27, 2026 | $6.2B | +60% | 3.0% | $128M | $1.1B |
| Q3 FY26 | 10-Q | Dec 5, 2025 | $4.2B | +36% | 2.2% | $75.2M | −$248M |
| Q2 FY26 | 10-Q | Aug 28, 2025 | $3.6B | +5% | 12.4% | $381M | $558M |
| Q1 FY26 | 10-Q | Jun 9, 2025 | $3.2B | +5% | 11.5% | $264M | $178M |
| Q4 FY25 | 10-K | Mar 27, 2025 | $3.9B | +0.5% | 9.9% | $300M | $632M |
Charts
Interactive views
The same charts as the app — open one to draw it.
💵Where each $1 goesinteractive
Loading the interactive chart…
🌏Named in Asian annual reportsinteractive
Loading the interactive chart…
🔄Rotation against the market and its industry (RRG)interactive
Loading the interactive chart…
🔍Earnings qualityinteractive
Loading the interactive chart…
⚖️Fair value by methodinteractive
Loading the interactive chart…
🔭Outlook & guidanceinteractive
Loading the interactive chart…
📈Investments: gains and what it boughtinteractive
Loading the interactive chart…
🏭Its industry’s money flow (input-output)interactive
Loading the interactive chart…
Customers and suppliers named in filings
Buys from
About Dick's Sporting Goods
DICK’S Sporting Goods, Inc. (together with its subsidiaries, referred to as “the Company”, “we”, “us” and “our” unless specified otherwise) is a leading global sports retailer offering an extensive assortment of authentic, high-quality sports equipment, apparel, footwear and accessories. Our banners include DICK’S Sporting Goods, Golf Galaxy, Public Lands and Going Going Gone! stores in addition to the experiential retail concepts DICK’S House of Sport and Golf Galaxy Performance Center which are all located across the United States. Additionally, as owner and operator of Foot Locker, which includes Foot Locker, Kids Foot Locker, Champs Sports, WSS and atmos banners, we serve the global sneaker community across North America, Europe, Asia and Australia, plus a licensed store presence in Europe, the Middle East and Asia.
In its own words, from its 10-K, filed Mar 27, 2026.
Dick's Sporting Goods against its Retail-Miscellaneous Shopping Goods Stores peers
The largest companies of the same SEC industry, each at its latest quarter. Revenue growth: +53% against the peers' median +3%. Operating margin: 7.9% against the peers' median -0.4%.
| Company | Quarter | Revenue | Y/Y | Op. margin |
|---|---|---|---|---|
| DKS Dick's Sporting Goods | Q2 FY27 | $5.6B | +53% | 7.9% |
| ASO Academy Sports & Outdoors | Q2 FY27 | $1.6B | +3% | 15.0% |
| SPWH Sportsman's Warehouse Holdings | Q2 FY27 | $296M | +0.6% | -0.4% |
| BNED Barnes & Noble Education | Q1 FY27 | $291M | +0.8% | -5.9% |
| PEW GrabAGun Digital Holdings | Q2 2026 | $23.2M | +9% | -11.1% |
| KCRD Kindcard | Q2 FY27 | $73K | -20% | -74.5% |
Source: Dick's Sporting Goods 10-Q on SEC EDGAR · CIK 1089063 · Retail-Miscellaneous Shopping Goods Stores
Guidance and outlook
13F: who owns DKS and who is buying
More on DKS
- How Dick's Sporting Goods makes money: revenue by segment
- Dick's Sporting Goods next earnings date and what analysts expect
- Dick's Sporting Goods stock forecast, price target and fair value
- Who owns Dick's Sporting Goods stock: holders, funds and Congress trades
- Dick's Sporting Goods guidance and outlook
- Is Dick's Sporting Goods a takeover target? LBO and rumors
History
Every quarter: Q2 FY27 results · Q1 FY27 results · Q4 FY26 results · Q3 FY26 results · Q2 FY26 results · Q1 FY26 results · Q4 FY25 results
- Dick's Sporting Goods guidance history: guided vs reported
- Dick's Sporting Goods gross margin by quarter
- Dick's Sporting Goods operating margin by quarter
- Dick's Sporting Goods net income by quarter
- Dick's Sporting Goods free cash flow by quarter
- Dick's Sporting Goods capital expenditures by quarter
- Dick's Sporting Goods Footwear revenue by quarter
- Dick's Sporting Goods Hardlines revenue by quarter
- Dick's Sporting Goods Apparel revenue by quarter