Filing Flows › Other › Avis Budget Group (CAR)
Avis Budget Group (CAR) earnings and revenue breakdown
Latest: Q3 2026 · 10-Q filed Nov 4, 2026 · Avis Budget Group (CAR) Q3 2026 earnings results →
Q3 2026 Revenue down 2% year over year to $3.4B · 5¢ of every $1 of revenue kept as net profit · operating margin 9.0%
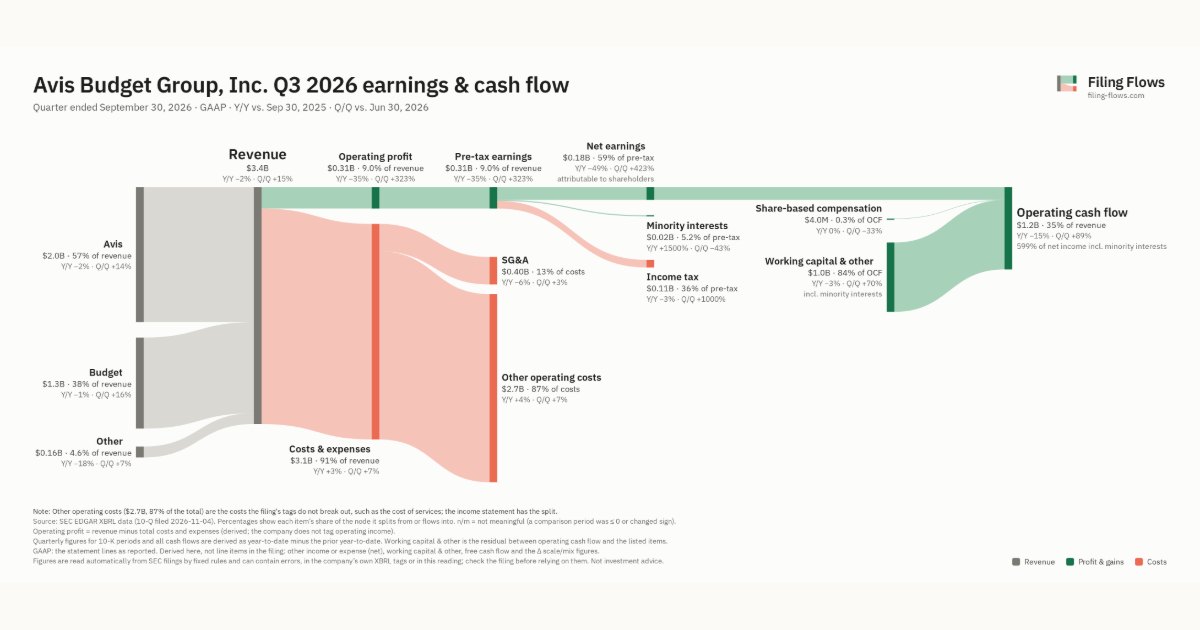
Avis Budget Group made $3.4B in Q3 2026 (-2% Y/Y): Avis $2.0B, Budget $1.3B, Other $158M. Operating margin 9.0%, net earnings $183M. See where every dollar goes — costs, profit and cash — as a Sankey from the 10-Q filed Nov 4, 2026.
Drawing the Sankey…
Open the interactive Sankey → click any line for what the company wrote about it, compare Y/Y and Q/Q, export as PNG or PDF
What changed this quarter
Revenue was $3.4B in Q3 2026, down 2% year over year and up 15% from the previous quarter. Avis was the largest line at 57% of revenue. Avis lost $0.04B year over year (down 2%), 49% of the total change.
Operating profit was $0.31B, a 9.0% margin (down 4.4 points year over year). Total costs grew 3% against a revenue fall of 2%. Net earnings were $0.18B, down 49% year over year. The effective tax rate was 35.6%.
Operating cash flow was $1.2B (down 15% year over year), 599% of net income including minority interests. Non-cash charges added back $4.0M of share-based compensation. Working capital and other items added $1.0B.
Quarterly history
| Quarter | Form | Filed | Revenue | Y/Y | Op. margin | Net earnings | Op. cash flow |
|---|---|---|---|---|---|---|---|
| Q3 2026 | 10-Q | Nov 4, 2026 | $3.4B | -2% | 9.0% | $183M | $1.2B |
| Q2 2026 | 10-Q | Jul 29, 2026 | $3.0B | -1% | 2.4% | $35.0M | $632M |
| Q1 2026 | 10-Q | Apr 29, 2026 | $2.5B | +4% | -13.4% | −$234M | $434M |
| Q4 2025 | 10-K | Feb 19, 2026 | $2.7B | -2% | -27.8% | −$856M | $437M |
| Q3 2025 | 10-Q | Oct 28, 2025 | $3.5B | +1% | 13.4% | $360M | $1.4B |
| Q2 2025 | 10-Q | Jul 30, 2025 | $3.0B | -0.3% | 0.5% | $5.0M | $837M |
| Q1 2025 | 10-Q | May 8, 2025 | $2.4B | -5% | -27.9% | −$504M | $619M |
Charts
Interactive views
The same charts as the app — open one to draw it.
💵Where each $1 goesinteractive
Loading the interactive chart…
🌏Named in Asian annual reportsinteractive
Loading the interactive chart…
🔄Rotation against the market and its industry (RRG)interactive
Loading the interactive chart…
🔍Earnings qualityinteractive
Loading the interactive chart…
⚖️Fair value by methodinteractive
Loading the interactive chart…
🔭Outlook & guidanceinteractive
Loading the interactive chart…
📈Investments: gains and what it boughtinteractive
Loading the interactive chart…
🏭Its industry’s money flow (input-output)interactive
Loading the interactive chart…
About Avis Budget Group
We are a leading global provider of mobility solutions through our three most recognized brands, Avis, Budget and Zipcar, as well as several other brands, well recognized in their respective markets. We license the use of the Avis, Budget, Zipcar and other brands’ trademarks to licensees in areas in which we do not operate directly. We and our licensees operate our brands in approximately 180 countries throughout the world. Our brands and mobility solutions have an extended global reach with approximately 10,000 rental locations throughout the world. We operate most of our car rental locations in North America, Europe and Australasia. We are headquartered in Parsippany, N.J. More information is available at avisbudgetgroup.com.
In its own words, from its 8-K, filed Jul 28, 2026.
Avis Budget Group against its Services-Auto Rental & Leasing (No Drivers) peers
The largest companies of the same SEC industry, each at its latest quarter. Revenue growth: -2% against the peers' median +3%. Operating margin: 9.0% against the peers' median 3.3%.
| Company | Quarter | Revenue | Y/Y | Op. margin |
|---|---|---|---|---|
| CAR Avis Budget Group | Q3 2026 | $3.4B | -2% | 9.0% |
| R Ryder System | Q3 2026 | $3.4B | +8% | 6.6% |
| HTZ Hertz Global Holdings | Q3 2026 | $2.6B | +6% | 3.3% |
| Hertz | Q2 2026 | $2.4B | +10% | 3.0% |
| UHAL U-Haul Holding | Q2 FY27 | $1.8B | +3% | 15.0% |
| ZCAR Zoomcar Holdings | Q1 FY27 | $2.4M | +2% | -37.4% |
| VAI Valor Energy | Q1 FY27 | $361K | -16% | -174.8% |
Source: Avis Budget Group 10-Q on SEC EDGAR · CIK 723612 · Services-Auto Rental & Leasing (No Drivers)
Guidance and outlook
13F: who owns CAR and who is buying
More on CAR
History
Every quarter: Q3 2026 results · Q2 2026 results · Q1 2026 results · Q4 2025 results · Q3 2025 results · Q2 2025 results · Q1 2025 results