Filing Flows › Other › Hertz Global Holdings (HTZ)
Hertz Global Holdings (HTZ) earnings and revenue breakdown
Latest: Q3 2026 · 10-Q filed Nov 5, 2026 · Hertz Global Holdings (HTZ) Q3 2026 earnings results →
Q3 2026 Revenue up 6% year over year to $2.6B · 4¢ of every $1 of revenue kept as net profit · operating margin 3.3%
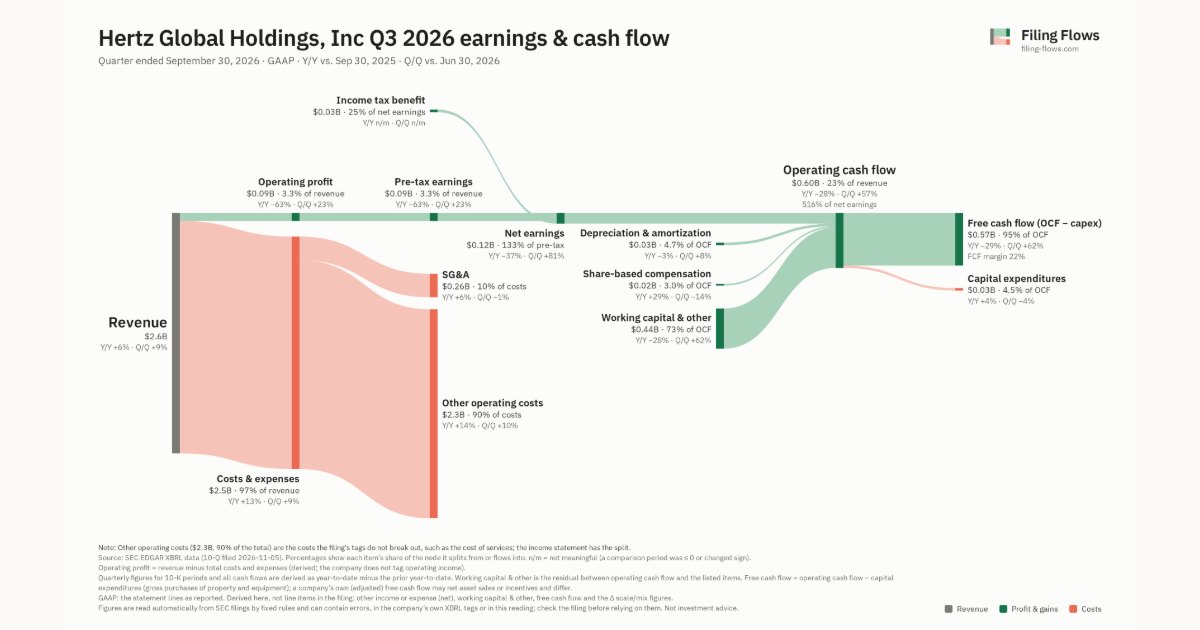
Hertz Global Holdings made $2.6B in Q3 2026 (+6% Y/Y). Operating margin 3.3%, net earnings $116M. See where every dollar goes — costs, profit and cash — as a Sankey from the 10-Q filed Nov 5, 2026.
Drawing the Sankey…
Open the interactive Sankey → click any line for what the company wrote about it, compare Y/Y and Q/Q, export as PNG or PDF
What changed this quarter
Revenue was $2.6B in Q3 2026, up 6% year over year and up 9% from the previous quarter.
Operating profit was $0.09B, a 3.3% margin (down 6.1 points year over year). Operating profit fell $0.15B even though revenue rose $0.14B versus Q3 2025, so costs grew faster than sales. Total costs grew 13% against revenue growth of 6%. The fastest-growing cost line was Other operating costs (+14%). Net earnings were $0.12B, down 37% year over year. The effective tax rate was -33.3%.
Operating cash flow was $0.60B (down 28% year over year), 516% of net earnings. Non-cash charges added back $0.03B of depreciation and amortization and $0.02B of share-based compensation. Working capital and other items added $0.44B. Capital expenditures of $0.03B left free cash flow of $0.57B.
Quarterly history
| Quarter | Form | Filed | Revenue | Y/Y | Op. margin | Net earnings | Op. cash flow |
|---|---|---|---|---|---|---|---|
| Q3 2026 | 10-Q | Nov 5, 2026 | $2.6B | +6% | 3.3% | $116M | $599M |
| Q2 2026 | 10-Q | Aug 6, 2026 | $2.4B | +10% | 3.0% | $64.0M | $381M |
| Q1 2026 | 10-Q | May 8, 2026 | $2.0B | +10% | -15.2% | −$333M | $20.0M |
| Q4 2025 | 10-K | Feb 26, 2026 | $2.0B | -0.6% | -11.0% | −$194M | $193M |
| Q3 2025 | 10-Q | Nov 4, 2025 | $2.5B | -4% | 9.4% | $184M | $835M |
| Q2 2025 | 10-Q | Aug 7, 2025 | $2.2B | -7% | -14.5% | −$294M | $346M |
| Q4 2024 | 10-K | Feb 18, 2025 | $2.0B | -7% | -27.6% | −$479M | $414M |
Charts
Interactive views
The same charts as the app — open one to draw it.
💵Where each $1 goesinteractive
Loading the interactive chart…
🌏Named in Asian annual reportsinteractive
Loading the interactive chart…
🔄Rotation against the market and its industry (RRG)interactive
Loading the interactive chart…
🔍Earnings qualityinteractive
Loading the interactive chart…
⚖️Fair value by methodinteractive
Loading the interactive chart…
🔭Outlook & guidanceinteractive
Loading the interactive chart…
📈Investments: gains and what it boughtinteractive
Loading the interactive chart…
🏭Its industry’s money flow (input-output)interactive
Loading the interactive chart…
About Hertz Global Holdings
there was a serious disruption in supply for any reason, including an act of war, terrorist incident or other problem affecting petroleum or energy supply, petroleum refining or energy distribution or pricing. We are subject to extensive federal, state, local and foreign environmental and safety laws, regulations, directives, rules and ordinances concerning, among other things, the operation and maintenance of vehicles; the ownership and operation of tanks for the storage of petroleum products, including gasoline, diesel fuel and oil; and the generation, storage, transportation and disposal of waste materials, including oil, vehicle wash sludge and waste water.
In its own words, from its 10-K, filed Feb 26, 2026.
Hertz Global Holdings against its Services-Auto Rental & Leasing (No Drivers) peers
The largest companies of the same SEC industry, each at its latest quarter. Revenue growth: +6% against the peers' median +3%. Operating margin: 3.3% against the peers' median 3.3%.
| Company | Quarter | Revenue | Y/Y | Op. margin |
|---|---|---|---|---|
| HTZ Hertz Global Holdings | Q3 2026 | $2.6B | +6% | 3.3% |
| CAR Avis Budget Group | Q3 2026 | $3.4B | -2% | 9.0% |
| R Ryder System | Q3 2026 | $3.4B | +8% | 6.6% |
| Hertz | Q2 2026 | $2.4B | +10% | 3.0% |
| UHAL U-Haul Holding | Q2 FY27 | $1.8B | +3% | 15.0% |
| ZCAR Zoomcar Holdings | Q1 FY27 | $2.4M | +2% | -37.4% |
| VAI Valor Energy | Q1 FY27 | $361K | -16% | -174.8% |
Source: Hertz Global Holdings 10-Q on SEC EDGAR · CIK 1657853 · Services-Auto Rental & Leasing (No Drivers)
Guidance and outlook
13F: who owns HTZ and who is buying
More on HTZ
- How Hertz Global Holdings makes money: revenue by segment
- Hertz Global Holdings next earnings date and what analysts expect
- Hertz Global Holdings stock forecast, price target and fair value
- Who owns Hertz Global Holdings stock: holders, funds and Congress trades
- Hertz Global Holdings guidance and outlook
History
Every quarter: Q3 2026 results · Q2 2026 results · Q1 2026 results · Q4 2025 results · Q3 2025 results · Q2 2025 results · Q4 2024 results