Filing Flows › Other › Ryder System (R)
Ryder System (R) earnings and revenue breakdown
Latest: Q3 2026 · 10-Q filed Oct 22, 2026 · Ryder System (R) Q3 2026 earnings results →
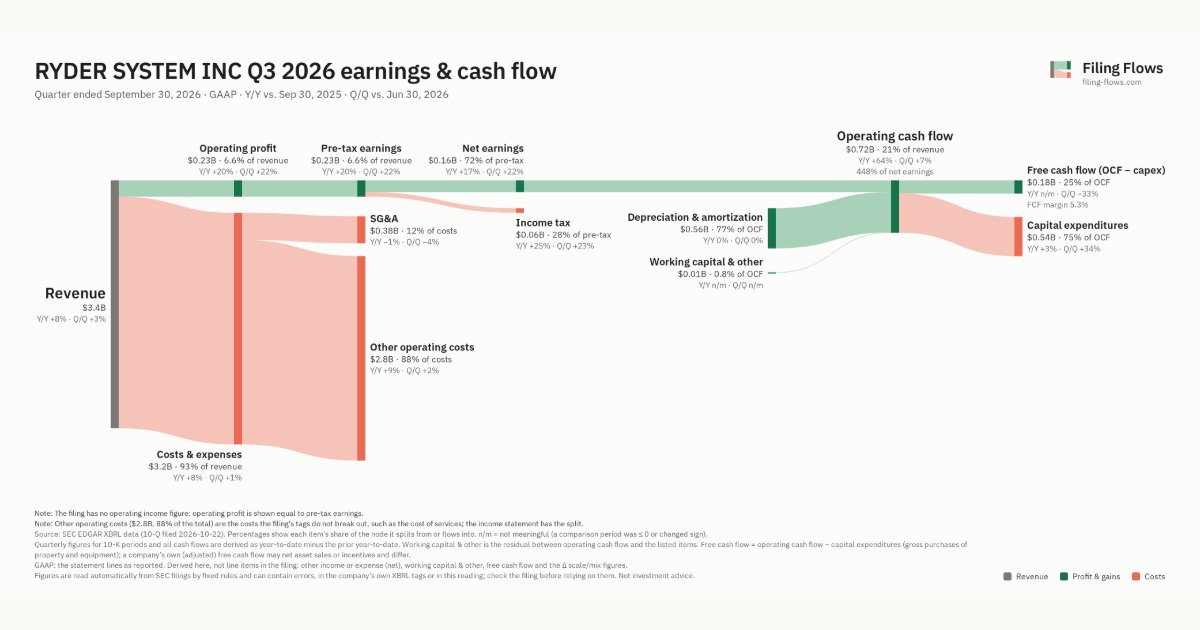
Q3 2026 Revenue up 8% year over year to $3.4B · 5¢ of every $1 of revenue kept as net profit · operating margin 6.6%
Ryder System made $3.4B in Q3 2026 (+8% Y/Y). Operating margin 6.6%, net earnings $162M. See where every dollar goes — costs, profit and cash — as a Sankey from the 10-Q filed Oct 22, 2026.
Drawing the Sankey…
Open the interactive Sankey → click any line for what the company wrote about it, compare Y/Y and Q/Q, export as PNG or PDF
What changed this quarter
Revenue was $3.4B in Q3 2026, up 8% year over year and up 3% from the previous quarter.
Operating profit was $0.23B, a 6.6% margin (up 0.6 points year over year). Of the extra revenue versus Q3 2025, 14% reached operating profit, above the 6% margin then. Total costs grew 8% against revenue growth of 8%. Net earnings were $0.16B, up 17% year over year. The effective tax rate was 28.3%.
Operating cash flow was $0.72B (up 64% year over year), 448% of net earnings. Non-cash charges added back $0.56B of depreciation and amortization. Capital expenditures of $0.54B left free cash flow of $0.18B.
Quarterly history
| Quarter | Form | Filed | Revenue | Y/Y | Op. margin | Net earnings | Op. cash flow |
|---|---|---|---|---|---|---|---|
| Q3 2026 | 10-Q | Oct 22, 2026 | $3.4B | +8% | 6.6% | $162M | $725M |
| Q2 2026 | 10-Q | Jul 23, 2026 | $3.3B | +5% | 5.5% | $133M | $677M |
| Q1 2026 | 10-Q | Apr 23, 2026 | $3.1B | -0.2% | 3.8% | $93.0M | $583M |
| Q4 2025 | 10-K | Feb 11, 2026 | $3.2B | -0.4% | 5.5% | $132M | $749M |
| Q3 2025 | 10-Q | Oct 23, 2025 | $3.2B | +0.1% | 6.0% | $138M | $442M |
| Q2 2025 | 10-Q | Jul 24, 2025 | $3.2B | +0.2% | 5.7% | $131M | $752M |
| Q1 2025 | 10-Q | Apr 23, 2025 | $3.1B | +1% | 4.3% | $98.0M | $651M |
Charts
Interactive views
The same charts as the app — open one to draw it.
💵Where each $1 goesinteractive
Loading the interactive chart…
🌏Named in Asian annual reportsinteractive
Loading the interactive chart…
🔄Rotation against the market and its industry (RRG)interactive
Loading the interactive chart…
🔍Earnings qualityinteractive
Loading the interactive chart…
⚖️Fair value by methodinteractive
Loading the interactive chart…
🔭Outlook & guidanceinteractive
Loading the interactive chart…
📈Investments: gains and what it boughtinteractive
Loading the interactive chart…
🏭Its industry’s money flow (input-output)interactive
Loading the interactive chart…
About Ryder System
Ryder System, Inc. (Ryder) is a leading provider of outsourced logistics and transportation services throughout North America. We offer port‑to‑door solutions that integrate every step of the supply chain, including international inbound flows and cross‑border logistics, fleet and transportation management, warehousing, manufacturing support and multi-channel final delivery. Our complementary business segments provide a broad range of value-added solutions, which provides our customers with a seamless, end‑to‑end logistics network designed to reduce complexity and improve speed, reliability and efficiency across the entire flow of goods. Ryder connects every link in the supply chain, moving products smoothly from ports and suppliers all the way to customers’ doorsteps as illustrated below.
In its own words, from its 10-K, filed Feb 11, 2026.
Ryder System against its Services-Auto Rental & Leasing (No Drivers) peers
The largest companies of the same SEC industry, each at its latest quarter. Revenue growth: +8% against the peers' median +3%. Operating margin: 6.6% against the peers' median 3.3%.
| Company | Quarter | Revenue | Y/Y | Op. margin |
|---|---|---|---|---|
| R Ryder System | Q3 2026 | $3.4B | +8% | 6.6% |
| CAR Avis Budget Group | Q3 2026 | $3.4B | -2% | 9.0% |
| HTZ Hertz Global Holdings | Q3 2026 | $2.6B | +6% | 3.3% |
| Hertz | Q2 2026 | $2.4B | +10% | 3.0% |
| UHAL U-Haul Holding | Q2 FY27 | $1.8B | +3% | 15.0% |
| ZCAR Zoomcar Holdings | Q1 FY27 | $2.4M | +2% | -37.4% |
| VAI Valor Energy | Q1 FY27 | $361K | -16% | -174.8% |
Source: Ryder System 10-Q on SEC EDGAR · CIK 85961 · Services-Auto Rental & Leasing (No Drivers)
13F: who owns R and who is buying
More on R
History
Every quarter: Q3 2026 results · Q2 2026 results · Q1 2026 results · Q4 2025 results · Q3 2025 results · Q2 2025 results · Q1 2025 results