Filing Flows › Financials › General Motors Financial Company
General Motors Financial Company earnings and revenue breakdown
Latest: Q3 2026 · 10-Q filed Oct 20, 2026
Q3 2026 Revenue down 1% year over year to $4.3B · 11¢ of every $1 of revenue kept as net profit · operating margin 15.3%
General Motors Financial Company made $4.3B in Q3 2026 (-0.6% Y/Y). Operating margin 15.3%, net earnings $487M. See where every dollar goes — costs, profit and cash — as a Sankey from the 10-Q filed Oct 20, 2026.
Drawing the Sankey…
Open the interactive Sankey → click any line for what the company wrote about it, compare Y/Y and Q/Q, export as PNG or PDF
What changed this quarter
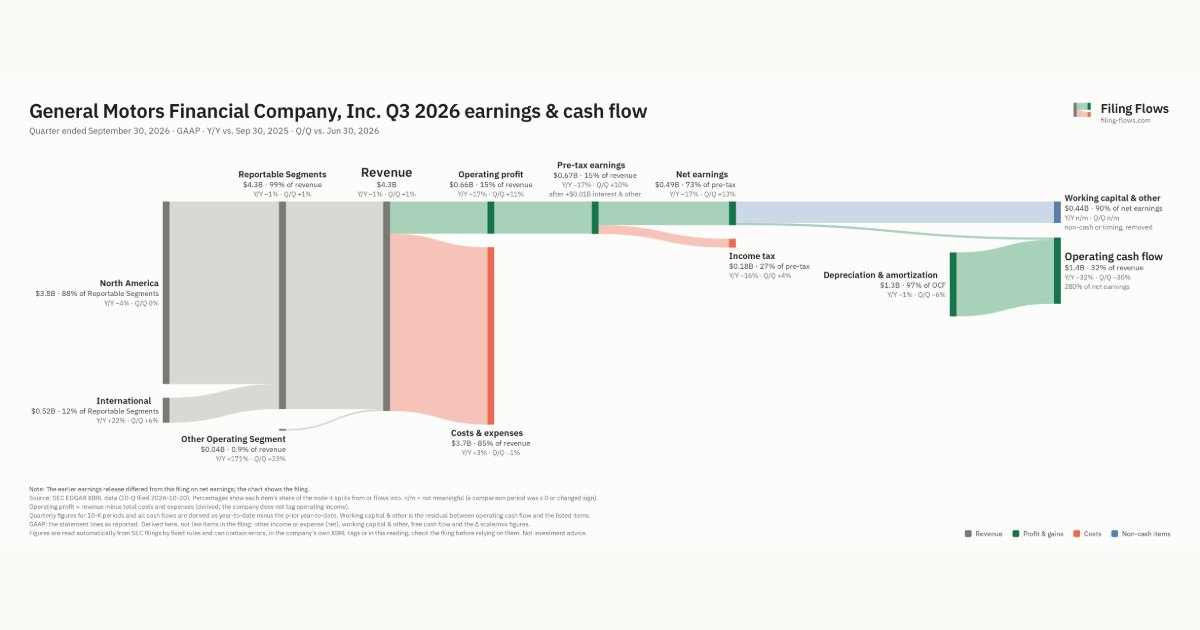
Revenue was $4.3B in Q3 2026, down 1% year over year and up 1% from the previous quarter.
Operating profit was $0.66B, a 15.3% margin (down 3.0 points year over year). Total costs grew 3% against a revenue fall of 1%. Net earnings were $0.49B, down 17% year over year. The effective tax rate was 27.1%.
Operating cash flow was $1.4B (down 32% year over year), 280% of net earnings. Non-cash charges added back $1.3B of depreciation and amortization. Working capital and other items used $0.44B.
Quarterly history
| Quarter | Form | Filed | Revenue | Y/Y | Op. margin | Net earnings | Op. cash flow |
|---|---|---|---|---|---|---|---|
| Q3 2026 | 10-Q | Oct 20, 2026 | $4.3B | -0.6% | 15.3% | $487M | $1.4B |
| Q2 2026 | 10-Q | Jul 21, 2026 | $4.3B | +0.3% | 13.9% | $432M | $1.9B |
| Q1 2026 | 10-Q | Apr 28, 2026 | $4.3B | +3% | 15.8% | $514M | $1.6B |
| Q4 2025 | 10-K | Jan 27, 2026 | $4.3B | +5% | 14.1% | $460M | $1.9B |
| Q3 2025 | 10-Q | Oct 21, 2025 | $4.3B | +8% | 18.3% | $589M | $2.0B |
| Q2 2025 | 10-Q | Jul 22, 2025 | $4.3B | +9% | 16.2% | $510M | $2.2B |
| Q1 2025 | 10-Q | May 1, 2025 | $4.2B | +9% | 16.2% | $499M | $1.9B |
Charts
Interactive views
The same charts as the app — open one to draw it.
💵Where each $1 goesinteractive
Loading the interactive chart…
🌏Named in Asian annual reportsinteractive
Loading the interactive chart…
🏭Its industry’s money flow (input-output)interactive
Loading the interactive chart…
Customers and suppliers named in filings
Buys from
About General Motors Financial Company
General General Motors Financial Company, Inc. (sometimes referred to as we, us, our, the Company, or GM Financial), the wholly-owned captive finance subsidiary of General Motors Company (GM), is a global provider of automobile finance solutions. Under the AmeriCredit, GM Financial, and GMAC trade names, we offer substantially similar products and services throughout many different regions, subject to local regulations and market conditions. We evaluate our business in two reportable segments: North America (the North America Segment) and International (the International Segment).
In its own words, from its 10-K, filed Jan 27, 2026.
General Motors Financial Company against its Finance Services peers
The largest companies of the same SEC industry, each at its latest quarter. Revenue growth: -0.6% against the peers' median +17%. Operating margin: 15.3% against the peers' median 5.1%.
| Company | Quarter | Revenue | Y/Y | Op. margin |
|---|---|---|---|---|
| General Motors Financial Company | Q3 2026 | $4.3B | -0.6% | 15.3% |
| AXP American Express | Q3 2026 | $20.1B | +9% | 22.6% |
| BTGO Bitgo Holdings | Q2 FY27 | $4.3B | +80% | -0.4% |
| SOFI SoFi Technologies | Q3 2026 | $1.4B | +44% | 22.9% |
| COIN Coinbase Global | Q3 2026 | $1.2B | -35% | 5.1% |
| CRCL Circle Internet Group | Q3 2026 | $865M | +17% | 24.1% |
| CHYM Chime Financial | Q3 2026 | $718M | +32% | 4.8% |
| GDOT Green DOT | Q2 2026 | $596M | +18% | -0.1% |
| BKKT Bakkt | Q2 2025 | $578M | +13% | -3.2% |
Source: General Motors Financial Company 10-Q on SEC EDGAR · CIK 804269 · Finance Services