Filing Flows › Financials › Coinbase Global (COIN)
Coinbase Global (COIN) earnings and revenue breakdown
Latest: Q3 2026 · 10-Q filed Oct 29, 2026 · Coinbase Global (COIN) Q3 2026 earnings results →
Q3 2026 Revenue down 35% year over year to $1.2B · 59¢ of every $1 of revenue kept as net profit · operating margin 5.1%
Coinbase Global made $1.2B in Q3 2026 (-35% Y/Y): Net revenue $1.2B, Other revenue $55.1M. Operating margin 5.1%, net earnings $719M. See where every dollar goes — costs, profit and cash — as a Sankey from the 10-Q filed Oct 29, 2026.
Drawing the Sankey…
Open the interactive Sankey → click any line for what the company wrote about it, compare Y/Y and Q/Q, export as PNG or PDF
What changed this quarter
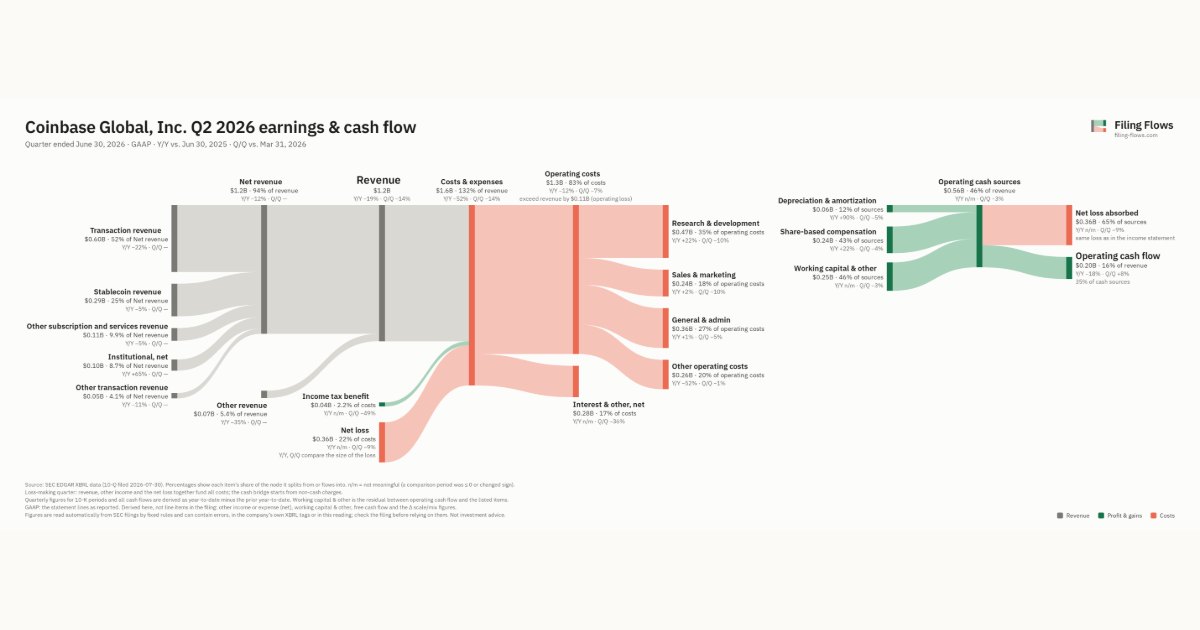
Revenue was $1.2B in Q3 2026, down 35% year over year and roughly flat from the previous quarter. Subscription and services revenue was the largest line at 47% of revenue. Subscription and services revenue lost $0.15B year over year (down 20%), 22% of the total change.
Operating profit was $0.06B, a 5.1% margin (down 20.6 points year over year). Total costs fell 17% while revenue fell 35%. Net earnings were $0.72B, up 66% year over year. The effective tax rate was 12.8%. Non-operating items added $0.76B, 93% of pre-tax earnings, so the bottom line overstates operating performance.
Operating cash flow was $0.41B (down 43% year over year), 56% of net earnings. Non-cash charges added back $0.06B of depreciation and amortization and $0.23B of share-based compensation. Working capital and other items used $0.61B.
Quarterly history
| Quarter | Form | Filed | Revenue | Y/Y | Op. margin | Net earnings | Op. cash flow |
|---|---|---|---|---|---|---|---|
| Q3 2026 | 10-Q | Oct 29, 2026 | $1.2B | -35% | 5.1% | $719M | $405M |
| Q2 2026 | 10-Q | Jul 30, 2026 | $1.2B | -18% | -9.3% | −$359M | $197M |
| Q1 2026 | 10-Q | May 7, 2026 | $1.4B | -30% | -1.5% | −$394M | $183M |
| Q4 2025 | 10-K | Feb 12, 2026 | $1.8B | -22% | 15.4% | −$667M | $3.1B |
| Q3 2025 | 10-Q | Oct 30, 2025 | $1.9B | +55% | 25.7% | $433M | −$785M |
| Q2 2025 | 10-Q | Jul 31, 2025 | $1.5B | +3% | -1.6% | $1.4B | $328M |
| Q1 2025 | 10-Q | May 8, 2025 | $2.0B | +24% | 34.7% | $65.6M | −$183M |
Charts
In supply chains and themes
Interactive views
The same charts as the app — open one to draw it.
💵Where each $1 goesinteractive
Loading the interactive chart…
🌏Named in Asian annual reportsinteractive
Loading the interactive chart…
🔄Rotation against the market and its industry (RRG)interactive
Loading the interactive chart…
🔍Earnings qualityinteractive
Loading the interactive chart…
⚖️Fair value by methodinteractive
Loading the interactive chart…
🔭Outlook & guidanceinteractive
Loading the interactive chart…
📈Investments: gains and what it boughtinteractive
Loading the interactive chart…
🏭Its industry’s money flow (input-output)interactive
Loading the interactive chart…
About Coinbase Global
We are working to update the century-old financial system by providing a trusted platform that makes it easy for our customers to engage with crypto assets. In December 2025, we took a major step forward to becoming the Everything Exchange—dramatically expanding the assets available to trade on Coinbase, including stocks, commodity futures, perpetual futures, and prediction markets. Our goal is to create a comprehensive, seamless experience for retail users, institutions, and developers to engage in the future of finance. • Trust : We are deeply invested in building the most secure and compliant platform. We hold customer assets one-to-one at all times.
In its own words, from its 10-K, filed Feb 12, 2026.
Coinbase Global against its Finance Services peers
The largest companies of the same SEC industry, each at its latest quarter. Revenue growth: -35% against the peers' median +17%. Operating margin: 5.1% against the peers' median 5.1%.
| Company | Quarter | Revenue | Y/Y | Op. margin |
|---|---|---|---|---|
| COIN Coinbase Global | Q3 2026 | $1.2B | -35% | 5.1% |
| AXP American Express | Q3 2026 | $20.1B | +9% | 22.6% |
| BTGO Bitgo Holdings | Q2 FY27 | $4.3B | +80% | -0.4% |
| General Motors Financial Company | Q3 2026 | $4.3B | -0.6% | 15.3% |
| SOFI SoFi Technologies | Q3 2026 | $1.4B | +44% | 22.9% |
| CRCL Circle Internet Group | Q3 2026 | $865M | +17% | 24.1% |
| CHYM Chime Financial | Q3 2026 | $718M | +32% | 4.8% |
| GDOT Green DOT | Q2 2026 | $596M | +18% | -0.1% |
| BKKT Bakkt | Q2 2025 | $578M | +13% | -3.2% |
Source: Coinbase Global 10-Q on SEC EDGAR · CIK 1679788 · Finance Services
13F: who owns COIN and who is buying
More on COIN
- How Coinbase Global makes money: revenue by segment
- Coinbase Global next earnings date and what analysts expect
- Coinbase Global stock forecast, price target and fair value
- Who owns Coinbase Global stock: holders, funds and Congress trades
- Is Coinbase Global a takeover target? LBO and rumors
- Coinbase Global recalls, complaints and regulation
History
Every quarter: Q3 2026 results · Q2 2026 results · Q1 2026 results · Q4 2025 results · Q3 2025 results · Q2 2025 results · Q1 2025 results
Compare COIN with
- Coinbase Global vs American Express (COIN vs AXP)
- Coinbase Global vs Bitgo Holdings (COIN vs BTGO)
- Coinbase Global vs SoFi Technologies (COIN vs SOFI)
- Coinbase Global vs Circle Internet Group (COIN vs CRCL)
- Coinbase Global vs Chime Financial (COIN vs CHYM)
- Coinbase Global vs Robinhood Markets (COIN vs HOOD)