Filing Flows › Financials › SoFi Technologies (SOFI)
SoFi Technologies (SOFI) earnings and revenue breakdown
Latest: Q3 2026 · 10-Q filed Nov 5, 2026 · SoFi Technologies (SOFI) Q3 2026 earnings results →
Q3 2026 Revenue up 44% year over year to $1.4B · 17¢ of every $1 of revenue kept as net profit · operating margin 22.9%
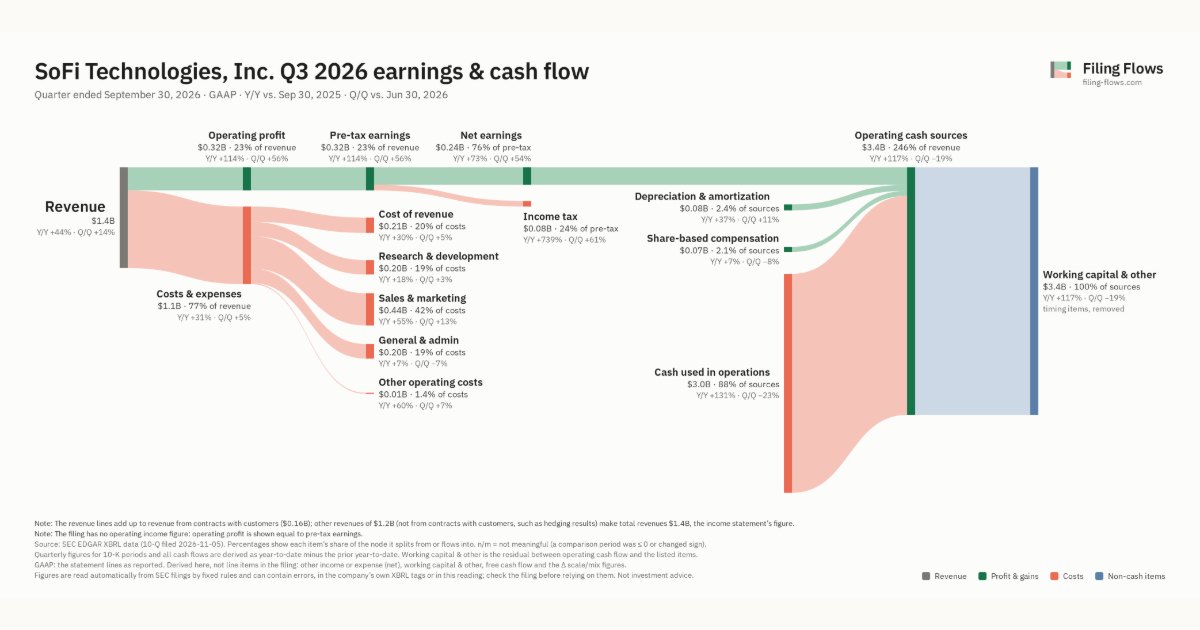
SoFi Technologies made $1.4B in Q3 2026 (+44% Y/Y). Operating margin 22.9%, net earnings $241M. See where every dollar goes — costs, profit and cash — as a Sankey from the 10-Q filed Nov 5, 2026.
Drawing the Sankey…
Open the interactive Sankey → click any line for what the company wrote about it, compare Y/Y and Q/Q, export as PNG or PDF
What changed this quarter
Revenue was $1.4B in Q3 2026, up 44% year over year and up 14% from the previous quarter.
Operating profit was $0.32B, a 22.9% margin (up 7.5 points year over year). Of the extra revenue versus Q3 2025, 40% reached operating profit, above the 15% margin then. Total costs grew 31% against revenue growth of 44%. The fastest-growing cost line was Other operating costs (+60%). Net earnings were $0.24B, up 73% year over year. The effective tax rate was 24.2%.
Operating cash flow was −$3.0B. Non-cash charges added back $0.08B of depreciation and amortization and $0.07B of share-based compensation. Working capital and other items used $3.4B.
Quarterly history
| Quarter | Form | Filed | Revenue | Y/Y | Op. margin | Net earnings | Op. cash flow |
|---|---|---|---|---|---|---|---|
| Q3 2026 | 10-Q | Nov 5, 2026 | $1.4B | +44% | 22.9% | $241M | −$3.0B |
| Q2 2026 | 10-Q | Aug 6, 2026 | $1.2B | +42% | 16.8% | $157M | −$3.9B |
| Q1 2026 | 10-Q | May 7, 2026 | $1.1B | +43% | 18.1% | $167M | −$2.3B |
| Q4 2025 | 10-K | Feb 17, 2026 | $1.0B | +40% | 18.1% | $174M | −$991M |
| Q3 2025 | 10-Q | Nov 6, 2025 | $962M | +38% | 15.4% | $139M | −$1.3B |
| Q2 2025 | 10-Q | Aug 7, 2025 | $855M | +43% | 13.1% | $97.3M | −$1.5B |
| Q1 2025 | 10-Q | May 6, 2025 | $772M | +20% | 10.3% | $71.1M | $21.5M |
Charts
Interactive views
The same charts as the app — open one to draw it.
💵Where each $1 goesinteractive
Loading the interactive chart…
🌏Named in Asian annual reportsinteractive
Loading the interactive chart…
🔄Rotation against the market and its industry (RRG)interactive
Loading the interactive chart…
🔍Earnings qualityinteractive
Loading the interactive chart…
⚖️Fair value by methodinteractive
Loading the interactive chart…
🔭Outlook & guidanceinteractive
Loading the interactive chart…
📈Investments: gains and what it boughtinteractive
Loading the interactive chart…
🏭Its industry’s money flow (input-output)interactive
Loading the interactive chart…
About SoFi Technologies
We are a mission driven company designed to help our members achieve financial independence in order to realize their ambitions. To us, financial independence does not mean being wealthy, but rather represents the ability of our members to have the financial means to achieve their personal objectives at each stage of life, such as owning a home, having a family, or having a career of their choice — more simply stated, to have enough money to do what they want. We were founded in 2011 and have developed a suite of financial products that offers the speed, selection, content and convenience that only an integrated digital platform can provide. In order for us to achieve our mission, we have to help people get their money right, which means providing them with the ability to borrow better, save better, spend better, invest better and protect better.
In its own words, from its 10-K, filed Feb 17, 2026.
SoFi Technologies against its Finance Services peers
The largest companies of the same SEC industry, each at its latest quarter. Revenue growth: +44% against the peers' median +17%. Operating margin: 22.9% against the peers' median 5.1%.
| Company | Quarter | Revenue | Y/Y | Op. margin |
|---|---|---|---|---|
| SOFI SoFi Technologies | Q3 2026 | $1.4B | +44% | 22.9% |
| AXP American Express | Q3 2026 | $20.1B | +9% | 22.6% |
| BTGO Bitgo Holdings | Q2 FY27 | $4.3B | +80% | -0.4% |
| General Motors Financial Company | Q3 2026 | $4.3B | -0.6% | 15.3% |
| COIN Coinbase Global | Q3 2026 | $1.2B | -35% | 5.1% |
| CRCL Circle Internet Group | Q3 2026 | $865M | +17% | 24.1% |
| CHYM Chime Financial | Q3 2026 | $718M | +32% | 4.8% |
| GDOT Green DOT | Q2 2026 | $596M | +18% | -0.1% |
| BKKT Bakkt | Q2 2025 | $578M | +13% | -3.2% |
Source: SoFi Technologies 10-Q on SEC EDGAR · CIK 1818874 · Finance Services
Guidance and outlook
13F: who owns SOFI and who is buying
More on SOFI
History
Every quarter: Q3 2026 results · Q2 2026 results · Q1 2026 results · Q4 2025 results · Q3 2025 results · Q2 2025 results · Q1 2025 results