Filing Flows › Consumer Staples › Publix Super Markets
Publix Super Markets earnings and revenue breakdown
Latest: Q3 2026 · 10-Q filed Nov 2, 2026
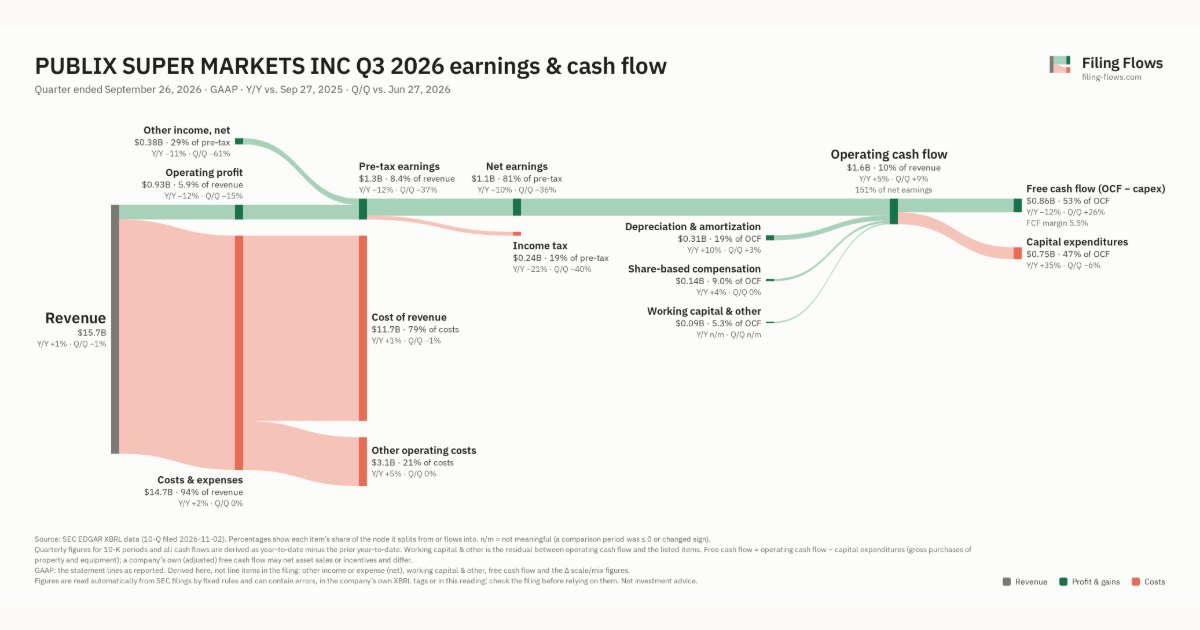
Q3 2026 Revenue up 1% year over year to $15.7B · 7¢ of every $1 of revenue kept as net profit · operating margin 5.9%
Publix Super Markets made $15.7B in Q3 2026 (+1% Y/Y). Operating margin 5.9%, net earnings $1.1B. See where every dollar goes — costs, profit and cash — as a Sankey from the 10-Q filed Nov 2, 2026.
Drawing the Sankey…
Open the interactive Sankey → click any line for what the company wrote about it, compare Y/Y and Q/Q, export as PNG or PDF
What changed this quarter
Revenue was $15.7B in Q3 2026, up 1% year over year and down 1% from the previous quarter.
Operating profit was $0.93B, a 5.9% margin (down 0.9 points year over year). Operating profit fell $0.13B even though revenue rose $0.16B versus Q3 2025, so costs grew faster than sales. Total costs grew 2% against revenue growth of 1%. Net earnings were $1.1B, down 10% year over year. The effective tax rate was 18.6%. Non-operating items added $0.38B, 29% of pre-tax earnings, so the bottom line overstates operating performance.
Operating cash flow was $1.6B (up 5% year over year), 151% of net earnings. Non-cash charges added back $0.31B of depreciation and amortization and $0.14B of share-based compensation. Working capital and other items added $0.09B. Capital expenditures of $0.75B left free cash flow of $0.86B.
Quarterly history
| Quarter | Form | Filed | Revenue | Y/Y | Op. margin | Net earnings | Op. cash flow |
|---|---|---|---|---|---|---|---|
| Q3 2026 | 10-Q | Nov 2, 2026 | $15.7B | +1% | 5.9% | $1.1B | $1.6B |
| Q2 2026 | 10-Q | Aug 3, 2026 | $15.9B | +1% | 6.9% | $1.7B | $1.5B |
| Q1 2026 | 10-Q | May 1, 2026 | $16.3B | +2% | 7.9% | $794M | $2.2B |
| Q4 2025 | 10-K | Mar 2, 2026 | $16.1B | +3% | 6.6% | $1.2B | $1.1B |
| Q3 2025 | 10-Q | Nov 3, 2025 | $15.5B | +5% | 6.9% | $1.2B | $1.5B |
| Q2 2025 | 10-Q | Aug 1, 2025 | $15.7B | +7% | 7.3% | $1.4B | $1.2B |
| Q1 2025 | 10-Q | May 1, 2025 | $15.9B | +5% | 8.4% | $1.0B | $2.1B |
Charts
Interactive views
The same charts as the app — open one to draw it.
💵Where each $1 goesinteractive
Loading the interactive chart…
🌏Named in Asian annual reportsinteractive
Loading the interactive chart…
🏭Its industry’s money flow (input-output)interactive
Loading the interactive chart…
About Publix Super Markets
Publix Super Markets, Inc. and its wholly owned subsidiaries (Company) are in the business of operating retail food supermarkets in Florida, Georgia, Alabama, South Carolina, North Carolina, Tennessee, Virginia and Kentucky. The Company was founded in 1930 and has no other significant lines of business or industry segments. The Company sells a variety of merchandise which includes perishable products (including dairy, produce, floral, deli, bakery, meat, seafood and frozen foods) and non-perishable products and services (including grocery, health and beauty care, general merchandise, pharmacy and other goods and services). This merchandise includes nationally advertised and private label brands as well as unbranded products such as produce, meat and seafood. Private label items are produced in the Company’s facilities or manufactured for the Company by suppliers.
In its own words, from its 10-K, filed Mar 2, 2026.
Publix Super Markets against its Retail-Grocery Stores peers
The largest companies of the same SEC industry, each at its latest quarter. Revenue growth: +1% against the peers' median +2%. Operating margin: 5.9% against the peers' median 2.8%.
| Company | Quarter | Revenue | Y/Y | Op. margin |
|---|---|---|---|---|
| Publix Super Markets | Q3 2026 | $15.7B | +1% | 5.9% |
| KR Kroger | Q2 FY27 | $34.6B | +2% | 2.8% |
| ACI Albertsons Companies | Q2 FY27 | $18.9B | -0.1% | 0.9% |
| SFM Sprouts Farmers Market | Q3 2026 | $2.3B | +5% | 6.6% |
| IMKTA Ingles Markets | Q3 FY26 | $1.4B | +2% | 2.5% |
| WMK Weis Markets | Q3 2026 | $1.3B | +3% | 2.2% |
| GO Grocery Outlet Holding | Q2 2026 | $1.2B | +1% | 1.3% |
| YSWY Yesway | Q2 2026 | $921M | +36% | 5.2% |
| VLGEA Village Super Market | Q4 FY26 | $610M | +2% | 2.8% |
Source: Publix Super Markets 10-Q on SEC EDGAR · CIK 81061 · Retail-Grocery Stores