Filing Flows › Consumer Staples › Grocery Outlet Holding (GO)
Grocery Outlet Holding (GO) earnings and revenue breakdown
Latest: Q2 2026 · 10-Q filed Aug 12, 2026 · Grocery Outlet Holding (GO) Q2 2026 earnings results →
Q2 2026 Revenue up 1% year over year to $1.2B · 0¢ of every $1 of revenue kept as net profit · operating margin 1.3%
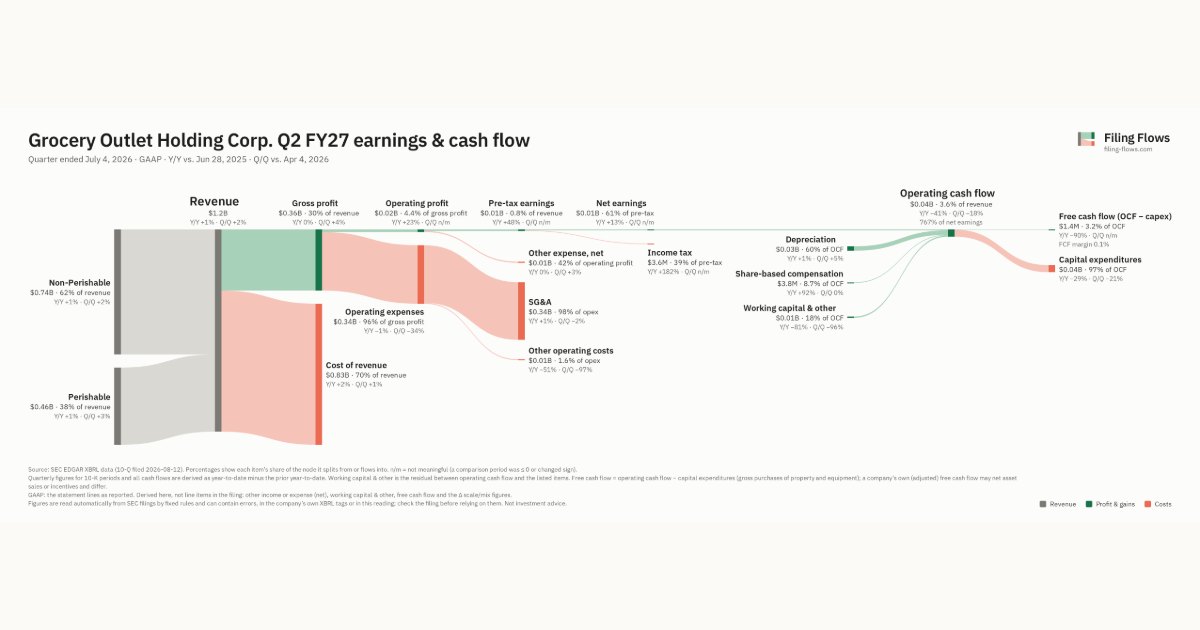
Grocery Outlet Holding made $1.2B in Q2 2026 (+1% Y/Y): Non-Perishable $737M, Perishable $455M. Operating margin 1.3%, net earnings $5.6M. See where every dollar goes — costs, profit and cash — as a Sankey from the 10-Q filed Aug 12, 2026.
Drawing the Sankey…
Open the interactive Sankey → click any line for what the company wrote about it, compare Y/Y and Q/Q, export as PNG or PDF
What changed this quarter
Revenue was $1.2B in Q2 2026, up 1% year over year and up 2% from the previous quarter. Non-Perishable was the largest line at 62% of revenue. Non-Perishable added $0.01B year over year (up 1%), 67% of the total change.
Gross margin was 30.2%, down 0.3 points from Q2 2025. Operating profit was $0.02B, a 1.3% margin (up 0.2 points year over year). Of the extra revenue versus Q2 2025, 23% reached operating profit, above the 1% margin then. Operating expenses fell 1% while revenue rose 1%. Net earnings were $0.01B, up 13% year over year. The effective tax rate was 38.8%.
Operating cash flow was $0.04B (down 41% year over year), 767% of net earnings. Non-cash charges added back $0.03B of depreciation and $3.8M of share-based compensation. Working capital and other items added $0.01B. Capital expenditures of $0.04B left free cash flow of $1.4M.
Quarterly history
| Quarter | Form | Filed | Revenue | Y/Y | Op. margin | Net earnings | Op. cash flow |
|---|---|---|---|---|---|---|---|
| Q2 2026 | 10-Q | Aug 12, 2026 | $1.2B | +1% | 1.3% | $5.6M | $43.1M |
| Q1 2026 | 10-Q | May 13, 2026 | $1.2B | +4% | -15.3% | −$180M | $52.6M |
| Q4 2025 | 10-K | Mar 4, 2026 | $1.2B | +11% | -19.3% | −$218M | $72.3M |
| Q3 2025 | 10-Q | Nov 5, 2025 | $1.2B | +5% | 2.0% | $11.6M | $17.3M |
| Q2 2025 | 10-Q | Aug 6, 2025 | $1.2B | +4% | 1.1% | $5.0M | $73.6M |
| Q1 2025 | 10-Q | May 7, 2025 | $1.1B | +8% | -2.0% | −$23.3M | $58.9M |
| Q4 2024 | 10-K | Feb 26, 2025 | $1.1B | +11% | 1.0% | $2.3M | $39.5M |
Charts
Interactive views
The same charts as the app — open one to draw it.
💵Where each $1 goesinteractive
Loading the interactive chart…
🌏Named in Asian annual reportsinteractive
Loading the interactive chart…
🔄Rotation against the market and its industry (RRG)interactive
Loading the interactive chart…
🔍Earnings qualityinteractive
Loading the interactive chart…
⚖️Fair value by methodinteractive
Loading the interactive chart…
🔭Outlook & guidanceinteractive
Loading the interactive chart…
📈Investments: gains and what it boughtinteractive
Loading the interactive chart…
🏭Its industry’s money flow (input-output)interactive
Loading the interactive chart…
About Grocery Outlet Holding
Grocery Outlet is a growth-oriented extreme value retailer of quality, name-brand consumables and fresh products sold primarily through a network of independently operated stores. As of January 3, 2026, we had 570 stores in California, Washington, Oregon, Pennsylvania, Tennessee, Idaho, Nevada, Maryland, Ohio, New Jersey, North Carolina, Georgia, Alabama, Delaware, Kentucky and Virginia. Our headquarters is in Emeryville, California. Each of our stores offers a fun, treasure hunt shopping experience in an easy-to-navigate, small-box format. An ever-changing assortment of "WOW!" deals, complemented by everyday staple products, generates customer excitement and encourages frequent visits from bargain-minded shoppers. Our flexible buying model allows us to offer quality, name-brand opportunistic products at prices generally 40% to 70% below those of conventional retailers.
In its own words, from its 10-K, filed Mar 4, 2026.
Grocery Outlet Holding against its Retail-Grocery Stores peers
The largest companies of the same SEC industry, each at its latest quarter. Revenue growth: +1% against the peers' median +2%. Operating margin: 1.3% against the peers' median 2.8%.
| Company | Quarter | Revenue | Y/Y | Op. margin |
|---|---|---|---|---|
| GO Grocery Outlet Holding | Q2 2026 | $1.2B | +1% | 1.3% |
| KR Kroger | Q2 FY27 | $34.6B | +2% | 2.8% |
| ACI Albertsons Companies | Q2 FY27 | $18.9B | -0.1% | 0.9% |
| Publix Super Markets | Q3 2026 | $15.7B | +1% | 5.9% |
| SFM Sprouts Farmers Market | Q3 2026 | $2.3B | +5% | 6.6% |
| IMKTA Ingles Markets | Q3 FY26 | $1.4B | +2% | 2.5% |
| WMK Weis Markets | Q3 2026 | $1.3B | +3% | 2.2% |
| YSWY Yesway | Q2 2026 | $921M | +36% | 5.2% |
| VLGEA Village Super Market | Q4 FY26 | $610M | +2% | 2.8% |
Source: Grocery Outlet Holding 10-Q on SEC EDGAR · CIK 1771515 · Retail-Grocery Stores
13F: who owns GO and who is buying
More on GO
- How Grocery Outlet Holding makes money: revenue by segment
- Grocery Outlet Holding next earnings date and what analysts expect
- Grocery Outlet Holding stock forecast, price target and fair value
- Who owns Grocery Outlet Holding stock: holders, funds and Congress trades
- Is Grocery Outlet Holding a takeover target? LBO and rumors
- Grocery Outlet Holding recalls, complaints and regulation
History
Every quarter: Q2 2026 results · Q1 2026 results · Q4 2025 results · Q3 2025 results · Q2 2025 results · Q1 2025 results · Q4 2024 results
- Grocery Outlet Holding gross margin by quarter
- Grocery Outlet Holding operating margin by quarter
- Grocery Outlet Holding net income by quarter
- Grocery Outlet Holding free cash flow by quarter
- Grocery Outlet Holding capital expenditures by quarter
- Grocery Outlet Holding Non-Perishable revenue by quarter
- Grocery Outlet Holding Perishable revenue by quarter
Compare GO with
- Grocery Outlet Holding vs Sprouts Farmers Market (GO vs SFM)
- Grocery Outlet Holding vs Ingles Markets (GO vs IMKTA)
- Grocery Outlet Holding vs Weis Markets (GO vs WMK)
- Grocery Outlet Holding vs Yesway (GO vs YSWY)
- Grocery Outlet Holding vs Village Super Market (GO vs VLGEA)
- Grocery Outlet Holding vs Natural Grocers by Vitamin Cottage (GO vs NGVC)