Filing Flows › Consumer Staples › Sprouts Farmers Market (SFM)
Sprouts Farmers Market (SFM) earnings and revenue breakdown
Latest: Q3 2026 · 10-Q filed Oct 28, 2026 · Sprouts Farmers Market (SFM) Q3 2026 earnings results →
Q3 2026 Revenue up 5% year over year to $2.3B · 5¢ of every $1 of revenue kept as net profit · operating margin 6.6%
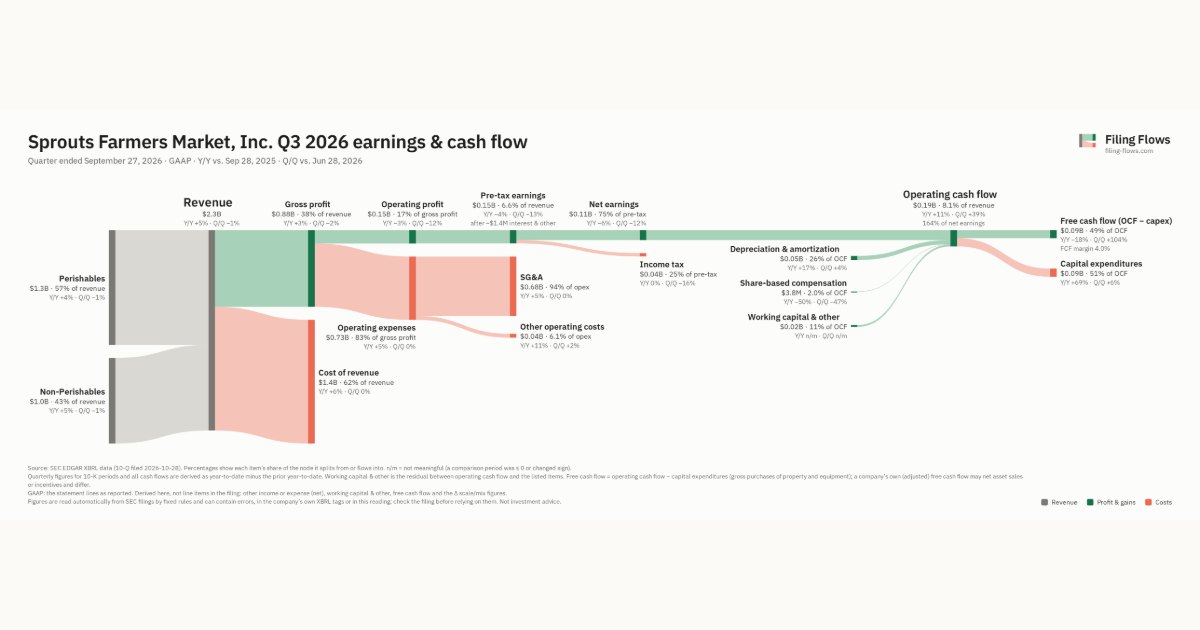
Sprouts Farmers Market made $2.3B in Q3 2026 (+5% Y/Y): Perishables $1.3B, Non-Perishables $985M. Operating margin 6.6%, net earnings $113M. See where every dollar goes — costs, profit and cash — as a Sankey from the 10-Q filed Oct 28, 2026.
Drawing the Sankey…
Open the interactive Sankey → click any line for what the company wrote about it, compare Y/Y and Q/Q, export as PNG or PDF
What changed this quarter
Revenue was $2.3B in Q3 2026, up 5% year over year and down 1% from the previous quarter. Perishables was the largest line at 57% of revenue. Perishables added $0.05B year over year (up 4%), 51% of the total change.
Gross margin was 38.2%, down 0.5 points from Q3 2025. Operating profit was $0.15B, a 6.6% margin (down 0.5 points year over year). Operating profit fell $4.6M even though revenue rose $0.10B versus Q3 2025, so costs grew faster than sales. Operating expenses grew 5% against revenue growth of 5%. The fastest-growing cost line was Other operating costs (+11%). Net earnings were $0.11B, down 6% year over year. The effective tax rate was 25.1%.
Operating cash flow was $0.19B (up 11% year over year), 164% of net earnings. Non-cash charges added back $0.05B of depreciation and amortization and $3.8M of share-based compensation. Working capital and other items added $0.02B. Capital expenditures of $0.09B left free cash flow of $0.09B.
Quarterly history
| Quarter | Form | Filed | Revenue | Y/Y | Op. margin | Net earnings | Op. cash flow |
|---|---|---|---|---|---|---|---|
| Q3 2026 | 10-Q | Oct 28, 2026 | $2.3B | +5% | 6.6% | $113M | $186M |
| Q2 2026 | 10-Q | Jul 29, 2026 | $2.3B | +5% | 7.5% | $129M | $134M |
| Q1 2026 | 10-Q | Apr 29, 2026 | $2.3B | +4% | 9.2% | $164M | $235M |
| Q4 2025 | 10-K | Feb 19, 2026 | $2.1B | +8% | 5.7% | $89.8M | $139M |
| Q3 2025 | 10-Q | Oct 29, 2025 | $2.2B | +13% | 7.2% | $120M | $167M |
| Q2 2025 | 10-Q | Jul 30, 2025 | $2.2B | +17% | 8.1% | $134M | $111M |
| Q1 2025 | 10-Q | Apr 30, 2025 | $2.2B | +19% | 10.1% | $180M | $299M |
Charts
Interactive views
The same charts as the app — open one to draw it.
💵Where each $1 goesinteractive
Loading the interactive chart…
🌏Named in Asian annual reportsinteractive
Loading the interactive chart…
🔄Rotation against the market and its industry (RRG)interactive
Loading the interactive chart…
🔍Earnings qualityinteractive
Loading the interactive chart…
⚖️Fair value by methodinteractive
Loading the interactive chart…
🔭Outlook & guidanceinteractive
Loading the interactive chart…
📈Investments: gains and what it boughtinteractive
Loading the interactive chart…
🏭Its industry’s money flow (input-output)interactive
Loading the interactive chart…
Customers and suppliers named in filings
Buys from
About Sprouts Farmers Market
Sprouts Farmers Market offers a unique specialty grocery experience featuring an open layout with fresh produce at the heart of the store. Sprouts inspires wellness naturally with a carefully curated assortment of better-for-you products paired with purpose-driven people. We continue to bring the latest in wholesome, innovative products made with lifestyle-friendly ingredients such as organic, plant-based and gluten-free. From our founding in 2002, we have grown rapidly, significantly increasing our sales, store count and profitability. Headquartered in Phoenix with 477 stores in 24 states as of December 28, 2025, we are one of the largest and fastest growing specialty retailers of fresh, natural and organic food in the United States.
In its own words, from its 10-K, filed Feb 19, 2026.
Sprouts Farmers Market against its Retail-Grocery Stores peers
The largest companies of the same SEC industry, each at its latest quarter. Revenue growth: +5% against the peers' median +2%. Operating margin: 6.6% against the peers' median 2.8%.
| Company | Quarter | Revenue | Y/Y | Op. margin |
|---|---|---|---|---|
| SFM Sprouts Farmers Market | Q3 2026 | $2.3B | +5% | 6.6% |
| KR Kroger | Q2 FY27 | $34.6B | +2% | 2.8% |
| ACI Albertsons Companies | Q2 FY27 | $18.9B | -0.1% | 0.9% |
| Publix Super Markets | Q3 2026 | $15.7B | +1% | 5.9% |
| IMKTA Ingles Markets | Q3 FY26 | $1.4B | +2% | 2.5% |
| WMK Weis Markets | Q3 2026 | $1.3B | +3% | 2.2% |
| GO Grocery Outlet Holding | Q2 2026 | $1.2B | +1% | 1.3% |
| YSWY Yesway | Q2 2026 | $921M | +36% | 5.2% |
| VLGEA Village Super Market | Q4 FY26 | $610M | +2% | 2.8% |
Source: Sprouts Farmers Market 10-Q on SEC EDGAR · CIK 1575515 · Retail-Grocery Stores
13F: who owns SFM and who is buying
More on SFM
- How Sprouts Farmers Market makes money: revenue by segment
- Sprouts Farmers Market next earnings date and what analysts expect
- Sprouts Farmers Market stock forecast, price target and fair value
- Who owns Sprouts Farmers Market stock: holders, funds and Congress trades
- Sprouts Farmers Market guidance and outlook
- Is Sprouts Farmers Market a takeover target? LBO and rumors
History
Every quarter: Q3 2026 results · Q2 2026 results · Q1 2026 results · Q4 2025 results · Q3 2025 results · Q2 2025 results · Q1 2025 results
- Sprouts Farmers Market guidance history: guided vs reported
- Sprouts Farmers Market gross margin by quarter
- Sprouts Farmers Market operating margin by quarter
- Sprouts Farmers Market net income by quarter
- Sprouts Farmers Market free cash flow by quarter
- Sprouts Farmers Market capital expenditures by quarter
- Sprouts Farmers Market Perishables revenue by quarter
- Sprouts Farmers Market Non-Perishables revenue by quarter