Filing Flows › Industrials › Concentrix (CNXC)
Concentrix (CNXC) earnings and revenue breakdown
Latest: Q3 FY26 · 10-Q filed Oct 7, 2026 · Concentrix (CNXC) Q3 FY26 earnings results →
Q3 FY26 Revenue down 1% year over year to $2.5B · 40¢ of every $1 of revenue lost · operating margin -37.1%
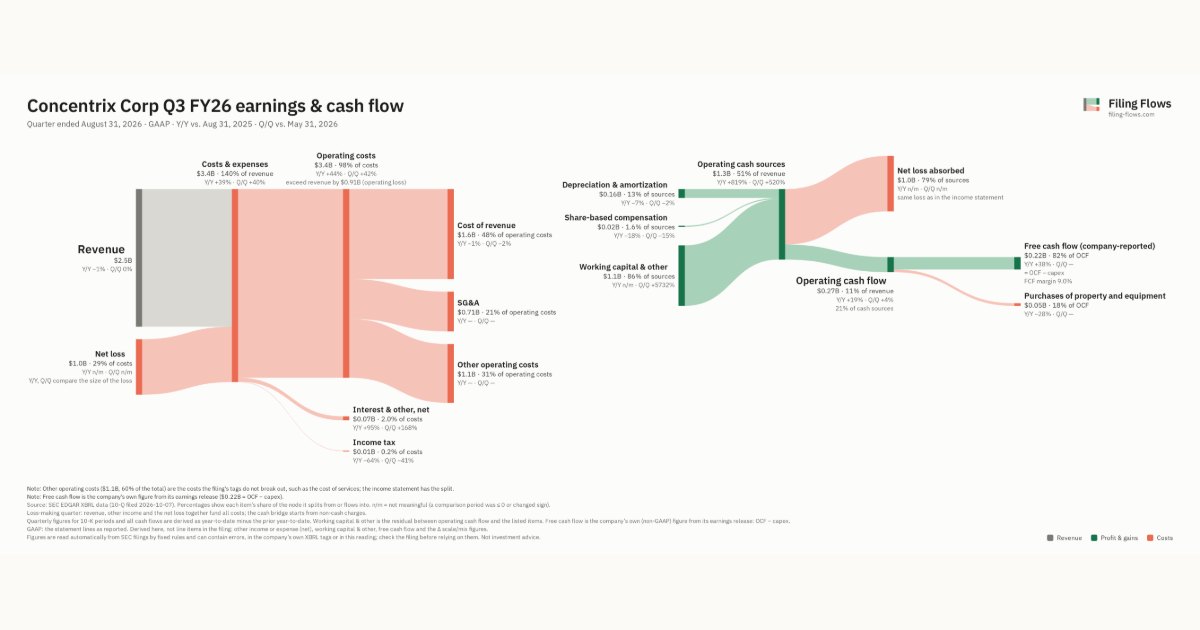
Concentrix made $2.5B in Q3 FY26 (-1% Y/Y). Operating margin -37.1%, net loss $988M. See where every dollar goes — costs, profit and cash — as a Sankey from the 10-Q filed Oct 7, 2026.
Drawing the Sankey…
Open the interactive Sankey → click any line for what the company wrote about it, compare Y/Y and Q/Q, export as PNG or PDF
What changed this quarter
Revenue was $2.5B in Q3 FY26, down 1% year over year and roughly flat from the previous quarter.
Gross margin was 34.6%, up 0.2 points from Q3 FY25. Operating costs exceeded revenue by $0.91B, an operating margin of -37.1%. Operating expenses grew 148% against a revenue fall of 1%. The quarter ended with a net loss of $1.0B, after a profit of $0.06B the previous quarter.
Operating cash flow was $0.27B (up 19% year over year). Non-cash charges added back $0.16B of depreciation and amortization and $0.02B of share-based compensation. Working capital and other items added $1.1B. After purchases of property and equipment ($0.05B), free cash flow as the company reports it was $0.22B.
Quarterly history
| Quarter | Form | Filed | Revenue | Y/Y | Op. margin | Net earnings | Op. cash flow |
|---|---|---|---|---|---|---|---|
| Q3 FY26 | 10-Q | Oct 7, 2026 | $2.5B | -1% | -37.1% | −$988M | $268M |
| Q2 FY26 | 10-Q | Jul 2, 2026 | $2.5B | +2% | 3.9% | $55.3M | $258M |
| Q1 FY26 | 10-Q | Apr 3, 2026 | $2.5B | +5% | 4.7% | $21.6M | −$83.2M |
| Q4 FY25 | 10-K | Jan 28, 2026 | $2.6B | +4% | -54.1% | −$1.5B | $344M |
| Q3 FY25 | 10-Q | Oct 3, 2025 | $2.5B | +4% | 5.9% | $88.1M | $225M |
| Q2 FY25 | 10-Q | Jul 3, 2025 | $2.4B | +2% | 6.1% | $42.1M | $237M |
| Q1 FY25 | 10-Q | Apr 4, 2025 | $2.4B | -1% | 7.1% | $70.3M | $1.4M |
Charts
Interactive views
The same charts as the app — open one to draw it.
💵Where each $1 goesinteractive
Loading the interactive chart…
🌏Named in Asian annual reportsinteractive
Loading the interactive chart…
🔄Rotation against the market and its industry (RRG)interactive
Loading the interactive chart…
🔍Earnings qualityinteractive
Loading the interactive chart…
⚖️Fair value by methodinteractive
Loading the interactive chart…
🔭Outlook & guidanceinteractive
Loading the interactive chart…
📈Investments: gains and what it boughtinteractive
Loading the interactive chart…
🏭Its industry’s money flow (input-output)interactive
Loading the interactive chart…
About Concentrix
We are a global technology and services leader that powers exceptional brand experiences and digital operations for more than 2,000 clients across the globe. We design, build, and run fully integrated, end-to-end solutions — including customer experience (“CX”) process optimization, technology innovation and design engineering, front- and back-office automation, analytics, and business transformation services — for clients in five primary industry verticals. Our solutions help our clients drive deep understanding, full lifecycle engagement, and differentiated customer experiences for their brands.
In its own words, from its 10-K, filed Jan 28, 2026.
Concentrix against its Services-Business Services, NEC peers
The largest companies of the same SEC industry, each at its latest quarter. Revenue growth: -1% against the peers' median +10%. Operating margin: -37.1% against the peers' median 9.8%.
| Company | Quarter | Revenue | Y/Y | Op. margin |
|---|---|---|---|---|
| CNXC Concentrix | Q3 FY26 | $2.5B | -1% | -37.1% |
| ACN Accenture | Q4 FY26 | $18.7B | +6% | 15.3% |
| UBER Uber Technologies | Q3 2026 | $14.8B | +10% | 9.8% |
| V Visa | Q4 FY26 | $12.1B | +13% | 59.8% |
| MELI MercadoLibre | Q3 2026 | $10.8B | +45% | 6.3% |
| MA Mastercard | Q3 2026 | $9.8B | +14% | 59.8% |
| PYPL PayPal Holdings | Q3 2026 | $8.6B | +2% | 16.3% |
| FISV Fiserv | Q3 2026 | $5.2B | -1% | -105.7% |
| DASH DoorDash | Q3 2026 | $4.6B | +34% | 9.6% |
Source: Concentrix 10-Q on SEC EDGAR · CIK 1803599 · Services-Business Services, NEC
Guidance and outlook
13F: who owns CNXC and who is buying
More on CNXC
History
Every quarter: Q3 FY26 results · Q2 FY26 results · Q1 FY26 results · Q4 FY25 results · Q3 FY25 results · Q2 FY25 results · Q1 FY25 results