Filing Flows › Consumer Staples › Corteva (CTVA)
Corteva (CTVA) earnings and revenue breakdown
Latest: Q2 2026 · 10-Q filed Jul 31, 2026 · Corteva (CTVA) Q2 2026 earnings results →
Q2 2026 Revenue down 1% year over year to $6.4B · 18¢ of every $1 of revenue kept as net profit · operating margin 24.7%
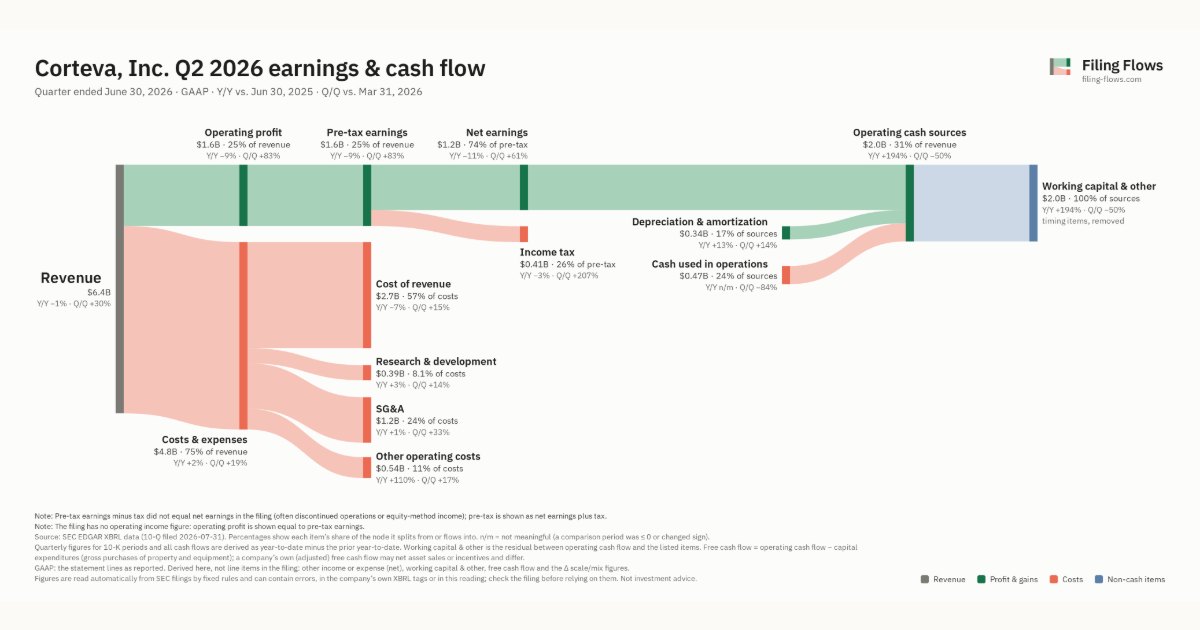
Corteva made $6.4B in Q2 2026 (-1% Y/Y). Operating margin 24.7%, net earnings $1.2B. See where every dollar goes — costs, profit and cash — as a Sankey from the 10-Q filed Jul 31, 2026.
Drawing the Sankey…
Open the interactive Sankey → click any line for what the company wrote about it, compare Y/Y and Q/Q, export as PNG or PDF
What changed this quarter
Revenue was $6.4B in Q2 2026, down 1% year over year and up 30% from the previous quarter.
Operating profit was $1.6B, a 24.7% margin (down 2.3 points year over year). Total costs grew 2% against a revenue fall of 1%. The fastest-growing cost line was Other operating costs (+110%). Net earnings were $1.2B, down 12% year over year. The effective tax rate was 25.9%.
Operating cash flow was −$0.47B. Non-cash charges added back $0.34B of depreciation and amortization. Working capital and other items used $2.0B. Capital expenditures of $0.12B exceeded it, leaving free cash flow of −$0.59B.
Quarterly history
| Quarter | Form | Filed | Revenue | Y/Y | Op. margin | Net earnings | Op. cash flow |
|---|---|---|---|---|---|---|---|
| Q2 2026 | 10-Q | Jul 31, 2026 | $6.4B | -1% | 24.7% | $1.2B | −$466M |
| Q1 2026 | 10-Q | May 6, 2026 | $4.9B | +11% | 17.5% | $723M | −$2.9B |
| Q4 2025 | 10-K | Feb 12, 2026 | $3.9B | -2% | -13.9% | −$549M | $4.4B |
| Q3 2025 | 10-Q | Nov 5, 2025 | $2.6B | +13% | -14.5% | −$318M | $193M |
| Q2 2025 | 10-Q | Aug 7, 2025 | $6.5B | +6% | 26.9% | $1.3B | $947M |
| Q1 2025 | 10-Q | May 8, 2025 | $4.4B | -2% | 17.5% | $656M | −$2.1B |
| Q4 2024 | 10-K | Feb 14, 2025 | $4.0B | +7% | 2.5% | −$39.0M | $4.2B |
Charts
Interactive views
The same charts as the app — open one to draw it.
💵Where each $1 goesinteractive
Loading the interactive chart…
🌏Named in Asian annual reportsinteractive
Loading the interactive chart…
🔄Rotation against the market and its industry (RRG)interactive
Loading the interactive chart…
🔍Earnings qualityinteractive
Loading the interactive chart…
⚖️Fair value by methodinteractive
Loading the interactive chart…
🔭Outlook & guidanceinteractive
Loading the interactive chart…
📈Investments: gains and what it boughtinteractive
Loading the interactive chart…
🏭Its industry’s money flow (input-output)interactive
Loading the interactive chart…
About Corteva
The company's European operations are subject to the European chemical regulation REACH (“Registration, Evaluation, Authorisation, and Restriction of Chemicals”) and the CLP (“Classification, Labeling, and Packaging of Substances and Mixtures”). Other jurisdictions also have rigorous approval processes, procedures and scientific testing requirements for the approval of crop protection products. We continue to monitor legislative and regulatory developments related to pollution and other environmental health and safety matters.
In its own words, from its 10-K, filed Feb 12, 2026.
Corteva against its Agricultural Production-Crops peers
The largest companies of the same SEC industry, each at its latest quarter. Revenue growth: -1% against the peers' median +5%. Operating margin: 24.7% against the peers' median 5.6%.
| Company | Quarter | Revenue | Y/Y | Op. margin |
|---|---|---|---|---|
| CTVA Corteva | Q2 2026 | $6.4B | -1% | 24.7% |
| DOLE Dole | Q2 2026 | $2.5B | +3% | 1.9% |
| DMC Del Monte | Q3 2026 | $1.1B | +7% | 2.7% |
| GTBIF Green Thumb Industries | Q3 2026 | $324M | +11% | 7.7% |
| VRNO Verano Holdings | Q3 2026 | $212M | +5% | 5.6% |
| TSNDF TerrAscend | Q3 2026 | $68.2M | +5% | 15.1% |
| VFF Village Farms International | Q2 2026 | $64.0M | +7% | 17.4% |
| LMNR Limoneira | Q3 FY26 | $43.8M | -8% | -6.8% |
| ITHUF iANTHUS Capital Holdings | Q2 2026 | $35.3M | +0.5% | -6.4% |
Source: Corteva 10-Q on SEC EDGAR · CIK 1755672 · Agricultural Production-Crops
Guidance and outlook
13F: who owns CTVA and who is buying
More on CTVA
History
Every quarter: Q2 2026 results · Q1 2026 results · Q4 2025 results · Q3 2025 results · Q2 2025 results · Q1 2025 results · Q4 2024 results