Filing Flows › Consumer Staples › CVS Health (CVS)
CVS Health (CVS) earnings and revenue breakdown
Latest: Q3 2026 · 10-Q filed Nov 4, 2026 · CVS Health (CVS) Q3 2026 earnings results →
Q3 2026 Revenue up 5% year over year to $108.4B · 2¢ of every $1 of revenue kept as net profit · operating margin 3.3%
CVS Health made $108.4B in Q3 2026 (+5% Y/Y). Operating margin 3.3%, net earnings $2.2B. See where every dollar goes — costs, profit and cash — as a Sankey from the 10-Q filed Nov 4, 2026.
Drawing the Sankey…
Open the interactive Sankey → click any line for what the company wrote about it, compare Y/Y and Q/Q, export as PNG or PDF
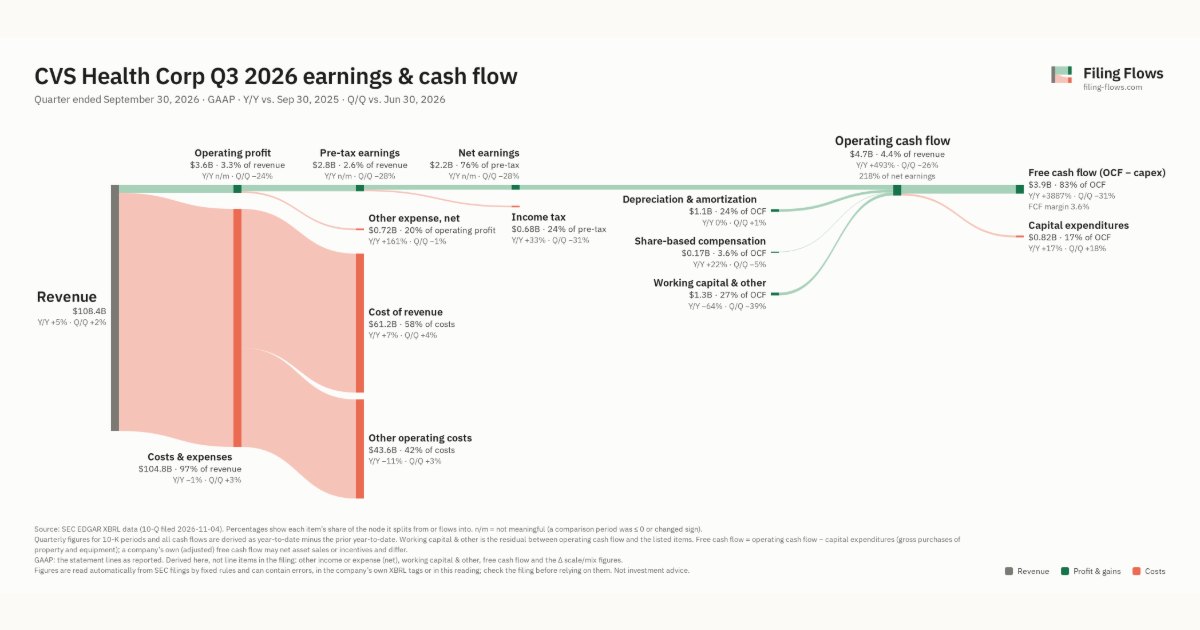
What changed this quarter
Revenue was $108.4B in Q3 2026, up 5% year over year and up 2% from the previous quarter.
Operating profit was $3.6B, a 3.3% margin (up 6.4 points year over year). Total costs fell 1% while revenue rose 5%. Net earnings were $2.2B. The effective tax rate was 23.8%.
Operating cash flow was $4.7B (up 493% year over year), 218% of net earnings. Non-cash charges added back $1.1B of depreciation and amortization and $0.17B of share-based compensation. Working capital and other items added $1.3B. Capital expenditures of $0.82B left free cash flow of $3.9B.
Quarterly history
| Quarter | Form | Filed | Revenue | Y/Y | Op. margin | Net earnings | Op. cash flow |
|---|---|---|---|---|---|---|---|
| Q3 2026 | 10-Q | Nov 4, 2026 | $108.4B | +5% | 3.3% | $2.2B | $4.7B |
| Q2 2026 | 10-Q | Aug 5, 2026 | $106.1B | +7% | 4.4% | $3.0B | $6.3B |
| Q1 2026 | 10-Q | May 6, 2026 | $100.4B | +6% | 4.7% | $3.0B | $4.2B |
| Q4 2025 | 10-K | Feb 10, 2026 | $105.7B | +8% | 2.0% | $2.9B | $3.4B |
| Q3 2025 | 10-Q | Oct 29, 2025 | $102.9B | +8% | -3.1% | −$4.0B | $796M |
| Q2 2025 | 10-Q | Jul 31, 2025 | $98.9B | +8% | 2.4% | $1.0B | $1.9B |
| Q1 2025 | 10-Q | May 1, 2025 | $94.6B | +7% | 3.6% | $1.8B | $4.6B |
Charts
Interactive views
The same charts as the app — open one to draw it.
💵Where each $1 goesinteractive
Loading the interactive chart…
🌏Named in Asian annual reportsinteractive
Loading the interactive chart…
🔄Rotation against the market and its industry (RRG)interactive
Loading the interactive chart…
🔍Earnings qualityinteractive
Loading the interactive chart…
⚖️Fair value by methodinteractive
Loading the interactive chart…
🔭Outlook & guidanceinteractive
Loading the interactive chart…
📈Investments: gains and what it boughtinteractive
Loading the interactive chart…
🏭Its industry’s money flow (input-output)interactive
Loading the interactive chart…
Customers and suppliers named in filings
Sells to
- U.S. government — 25% of its revenue · Stated in 10-K (XBRL) · source
- CAH · Stated in 10-K (named, share not stated) · source
Buys from
- HRMY — 38% of the supplier’s revenue · Stated in 10-K (sentence) · source
- CAH — 30% of the supplier’s revenue · Stated in 10-K (sentence) · source
- MCK — 24% of the supplier’s revenue · Stated in 10-K (sentence) · source
- AMRX · Stated in 10-K (named, share not stated) · source
About CVS Health
CVS Health Corporation, together with its subsidiaries (collectively, “CVS Health,” the “Company,” “we,” “our” or “us”), is a leading health solutions company building a world of health around every consumer it serves and connecting care so that it works for people wherever they are. As of December 31, 2025, we had approximately 9,000 retail locations, more than 1,000 walk-in and primary care medical clinics and a leading pharmacy benefits manager with approximately 87 million plan members and expanding specialty pharmacy solutions. We serve an estimated more than 37 million people through traditional, voluntary and consumer-directed health insurance products and related services, including expanding Medicare Advantage offerings and a leading standalone Medicare Part D prescription drug plan (“PDP”).
In its own words, from its 10-K, filed Feb 10, 2026.
CVS Health against its Retail-Drug Stores and Proprietary Stores peers
The largest companies of the same SEC industry, each at its latest quarter. Revenue growth: +5% against the peers' median -2%. Operating margin: 3.3% against the peers' median 3.3%.
| Company | Quarter | Revenue | Y/Y | Op. margin |
|---|---|---|---|---|
| CVS CVS Health | Q3 2026 | $108.4B | +5% | 3.3% |
| GRDN Guardian Pharmacy Services | Q3 2026 | $371M | -2% | 6.8% |
| PETS Petmed Express | Q1 FY27 | $41.0M | -20% | -15.2% |
Source: CVS Health 10-Q on SEC EDGAR · CIK 64803 · Retail-Drug Stores and Proprietary Stores
Guidance and outlook
13F: who owns CVS and who is buying
More on CVS
- How CVS Health makes money: revenue by segment
- CVS Health next earnings date and what analysts expect
- CVS Health stock forecast, price target and fair value
- Who owns CVS Health stock: holders, funds and Congress trades
- CVS Health guidance and outlook
- Is CVS Health a takeover target? LBO and rumors
- CVS Health recalls, complaints and regulation
History
Every quarter: Q3 2026 results · Q2 2026 results · Q1 2026 results · Q4 2025 results · Q3 2025 results · Q2 2025 results · Q1 2025 results