Filing Flows › Industrials › HF Sinclair (DINO)
HF Sinclair (DINO) earnings and revenue breakdown
Latest: Q3 2026 · 10-Q filed Oct 28, 2026 · HF Sinclair (DINO) Q3 2026 earnings results →
Q3 2026 Revenue up 50% year over year to $10.9B · 19¢ of every $1 of revenue kept as net profit · operating margin 24.6%
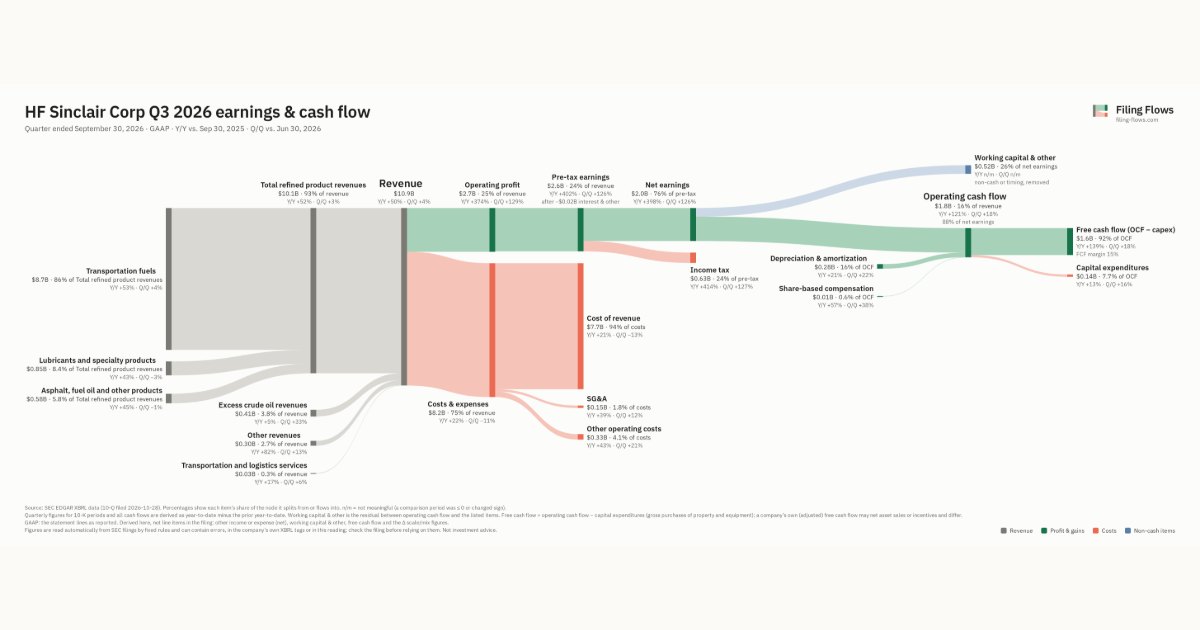
HF Sinclair made $10.9B in Q3 2026 (+50% Y/Y): Total refined product revenues $10.1B, Excess crude oil revenues $413M, Other revenues $298M. Operating margin 24.6%, net earnings $2.0B. See where every dollar goes — costs, profit and cash — as a Sankey from the 10-Q filed Oct 28, 2026.
Drawing the Sankey…
Open the interactive Sankey → click any line for what the company wrote about it, compare Y/Y and Q/Q, export as PNG or PDF
What changed this quarter
Revenue was $10.9B in Q3 2026, up 50% year over year and up 4% from the previous quarter. Transportation fuels was the largest line at 80% of revenue. Transportation fuels added $3.0B year over year (up 53%), 83% of the total change.
Operating profit was $2.7B, a 24.6% margin (up 16.8 points year over year). Of the extra revenue versus Q3 2025, 58% reached operating profit, above the 8% margin then. Total costs grew 22% against revenue growth of 50%. The fastest-growing cost line was Other operating costs (+43%). Net earnings were $2.0B, up 400% year over year. The effective tax rate was 23.9%.
Operating cash flow was $1.8B (up 121% year over year), 88% of net earnings. Non-cash charges added back $0.28B of depreciation and amortization and $0.01B of share-based compensation. Working capital and other items used $0.52B. Capital expenditures of $0.14B left free cash flow of $1.6B.
Quarterly history
| Quarter | Form | Filed | Revenue | Y/Y | Op. margin | Net earnings | Op. cash flow |
|---|---|---|---|---|---|---|---|
| Q3 2026 | 10-Q | Oct 28, 2026 | $10.9B | +50% | 24.6% | $2.0B | $1.8B |
| Q2 2026 | 10-Q | Jul 30, 2026 | $10.4B | +53% | 11.2% | $893M | $1.5B |
| Q1 2026 | 10-Q | May 1, 2026 | $7.1B | +12% | 11.9% | $650M | $457M |
| Q4 2025 | 10-K | Feb 27, 2026 | $6.5B | -0.6% | 0.1% | −$27.0M | $8.0M |
| Q3 2025 | 10-Q | Oct 30, 2025 | $7.3B | +0.6% | 7.8% | $405M | $809M |
| Q2 2025 | 10-Q | Jul 31, 2025 | $6.8B | -14% | 4.1% | $210M | $587M |
| Q1 2025 | 10-Q | May 1, 2025 | $6.4B | -9% | 1.3% | −$2.0M | −$89.0M |
Charts
Interactive views
The same charts as the app — open one to draw it.
💵Where each $1 goesinteractive
Loading the interactive chart…
🌏Named in Asian annual reportsinteractive
Loading the interactive chart…
🔄Rotation against the market and its industry (RRG)interactive
Loading the interactive chart…
🔍Earnings qualityinteractive
Loading the interactive chart…
⚖️Fair value by methodinteractive
Loading the interactive chart…
🔭Outlook & guidanceinteractive
Loading the interactive chart…
📈Investments: gains and what it boughtinteractive
Loading the interactive chart…
🏭Its industry’s money flow (input-output)interactive
Loading the interactive chart…
Customers and suppliers named in filings
Sells to
- SHEL — 11% of its revenue · Stated in 10-K (XBRL) · source
Buys from
About HF Sinclair
Description of Business: References herein to HF Sinclair Corporation (“HF Sinclair” or the “Company”) include HF Sinclair and its consolidated subsidiaries. In these interim consolidated financial statements, the words “we,” “our,” “ours” and “us” refer only to HF Sinclair and its consolidated subsidiaries or, in certain contexts, to HF Sinclair or an individual consolidated subsidiary and not to any other person, with certain exceptions. We are an independent energy company that produces and markets high-value light products such as gasoline, diesel fuel, jet fuel, renewable diesel and lubricants and specialty products. We own and operate refineries located in Kansas, Oklahoma, New Mexico, Wyoming, Washington and Utah. We provide petroleum product and crude oil transportation, terminalling, storage and throughput services to our refineries and the petroleum industry.
In its own words, from its 10-Q, filed Jul 30, 2026.
HF Sinclair against its Pipe Lines (No Natural Gas) peers
The largest companies of the same SEC industry, each at its latest quarter. Revenue growth: +50% against the peers' median +42%. Operating margin: 24.6% against the peers' median 14.4%.
| Company | Quarter | Revenue | Y/Y | Op. margin |
|---|---|---|---|---|
| DINO HF Sinclair | Q3 2026 | $10.9B | +50% | 24.6% |
| PAGP Plains GP Holdings LP | Q2 2026 | $17.7B | +66% | 2.2% |
| PAA Plains All American Pipeline LP | Q3 2026 | $15.2B | +31% | 3.4% |
| ENB Enbridge | Q3 2026 | $15.1B | +44% | 10.1% |
| MPLX Mplx LP | Q3 2026 | $3.6B | -0.4% | 40.9% |
| GEL Genesis Energy LP | Q3 2026 | $449M | +8% | 15.4% |
| DKL Delek Logistics Partners, LP | Q3 2026 | $372M | +42% | 14.4% |
Source: HF Sinclair 10-Q on SEC EDGAR · CIK 1915657 · Pipe Lines (No Natural Gas)
Guidance and outlook
13F: who owns DINO and who is buying
More on DINO
- How HF Sinclair makes money: revenue by segment
- HF Sinclair next earnings date and what analysts expect
- HF Sinclair stock forecast, price target and fair value
- Who owns HF Sinclair stock: holders, funds and Congress trades
- HF Sinclair guidance and outlook
- Is HF Sinclair a takeover target? LBO and rumors
- HF Sinclair recalls, complaints and regulation
History
Every quarter: Q3 2026 results · Q2 2026 results · Q1 2026 results · Q4 2025 results · Q3 2025 results · Q2 2025 results · Q1 2025 results