Filing Flows › Industrials › Plains GP Holdings LP (PAGP)
Plains GP Holdings LP (PAGP) earnings and revenue breakdown
Latest: Q2 2026 · 10-Q filed Aug 10, 2026 · Plains GP Holdings LP (PAGP) Q2 2026 earnings results →
Q2 2026 Revenue up 66% year over year to $17.7B · 2¢ of every $1 of revenue kept as net profit · operating margin 2.2%
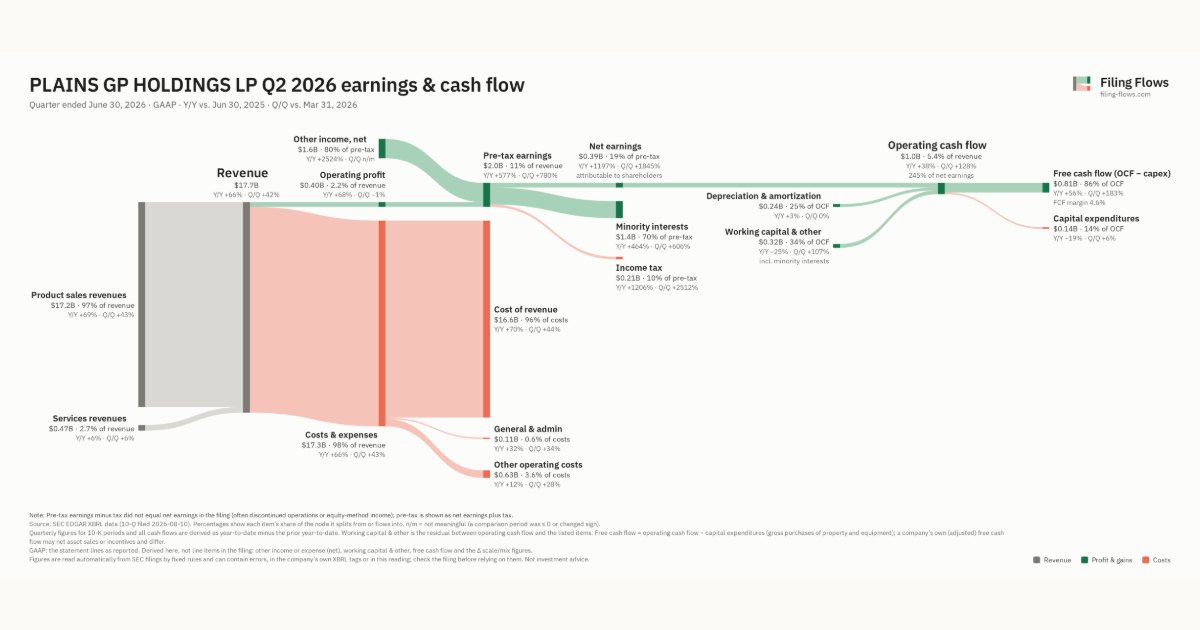
Plains GP Holdings LP made $17.7B in Q2 2026 (+66% Y/Y): Product sales revenues $17.2B, Services revenues $472M. Operating margin 2.2%, net earnings $389M. See where every dollar goes — costs, profit and cash — as a Sankey from the 10-Q filed Aug 10, 2026.
Drawing the Sankey…
Open the interactive Sankey → click any line for what the company wrote about it, compare Y/Y and Q/Q, export as PNG or PDF
What changed this quarter
Revenue was $17.7B in Q2 2026, up 66% year over year and up 42% from the previous quarter. Product sales revenues was the largest line at 97% of revenue. Product sales revenues added $7.0B year over year (up 69%), 100% of the total change.
Operating profit was $0.40B, a 2.2% margin (unchanged year over year). Of the extra revenue versus Q2 2025, 2% reached operating profit, above the 2% margin then. Total costs grew 66% against revenue growth of 66%. The fastest-growing cost line was Cost of revenue (+70%). Net earnings were $0.39B, up 1197% year over year. The effective tax rate was 10.3%. Non-operating items added $1.6B, 80% of pre-tax earnings, so the bottom line overstates operating performance.
Operating cash flow was $1.0B (up 38% year over year), 52% of net income including minority interests. Non-cash charges added back $0.24B of depreciation and amortization. Working capital and other items used $1.1B. Capital expenditures of $0.14B left free cash flow of $0.81B.
Quarterly history
| Quarter | Form | Filed | Revenue | Y/Y | Op. margin | Net earnings | Op. cash flow |
|---|---|---|---|---|---|---|---|
| Q2 2026 | 10-Q | Aug 10, 2026 | $17.7B | +66% | 2.2% | $389M | $952M |
| Q1 2026 | 10-Q | May 8, 2026 | $12.5B | +9% | 3.2% | $20.0M | $418M |
| Q4 2025 | 10-K | Feb 27, 2026 | $10.6B | -12% | 3.4% | $62.0M | $784M |
| Q3 2025 | 10-Q | Nov 7, 2025 | $11.6B | -7% | 4.2% | $83.0M | $817M |
| Q2 2025 | 10-Q | Aug 8, 2025 | $10.6B | -17% | 2.2% | $30.0M | $692M |
| Q1 2025 | 10-Q | May 9, 2025 | $11.5B | -1% | 4.6% | $84.0M | $638M |
| Q4 2024 | 10-K | Feb 28, 2025 | $12.0B | +6% | -0.1% | $116M | $726M |
Charts
Interactive views
The same charts as the app — open one to draw it.
💵Where each $1 goesinteractive
Loading the interactive chart…
🌏Named in Asian annual reportsinteractive
Loading the interactive chart…
🔄Rotation against the market and its industry (RRG)interactive
Loading the interactive chart…
🔍Earnings qualityinteractive
Loading the interactive chart…
⚖️Fair value by methodinteractive
Loading the interactive chart…
🔭Outlook & guidanceinteractive
Loading the interactive chart…
📈Investments: gains and what it boughtinteractive
Loading the interactive chart…
🏭Its industry’s money flow (input-output)interactive
Loading the interactive chart…
Customers and suppliers named in filings
Sells to
About Plains GP Holdings LP
PAA is a publicly traded master limited partnership that owns and operates midstream energy infrastructure and provides logistics services for crude oil. PAA owns an extensive network of pipeline gathering and transportation systems, in addition to terminalling, storage and other infrastructure assets serving key producing basins, transportation corridors and major market hubs and export outlets in the United States and Canada. PAGP is a publicly traded entity that owns an indirect, non-economic controlling general partner interest in PAA and an indirect limited partner interest in PAA, one of the largest energy infrastructure and logistics companies in North America.
In its own words, from its 8-K, filed Nov 6, 2026.
Plains GP Holdings LP against its Pipe Lines (No Natural Gas) peers
The largest companies of the same SEC industry, each at its latest quarter. Revenue growth: +66% against the peers' median +42%. Operating margin: 2.2% against the peers' median 14.4%.
| Company | Quarter | Revenue | Y/Y | Op. margin |
|---|---|---|---|---|
| PAGP Plains GP Holdings LP | Q2 2026 | $17.7B | +66% | 2.2% |
| PAA Plains All American Pipeline LP | Q3 2026 | $15.2B | +31% | 3.4% |
| ENB Enbridge | Q3 2026 | $15.1B | +44% | 10.1% |
| DINO HF Sinclair | Q3 2026 | $10.9B | +50% | 24.6% |
| MPLX Mplx LP | Q3 2026 | $3.6B | -0.4% | 40.9% |
| GEL Genesis Energy LP | Q3 2026 | $449M | +8% | 15.4% |
| DKL Delek Logistics Partners, LP | Q3 2026 | $372M | +42% | 14.4% |
Source: Plains GP Holdings LP 10-Q on SEC EDGAR · CIK 1581990 · Pipe Lines (No Natural Gas)
Guidance and outlook
13F: who owns PAGP and who is buying
More on PAGP
History
Every quarter: Q2 2026 results · Q1 2026 results · Q4 2025 results · Q3 2025 results · Q2 2025 results · Q1 2025 results · Q4 2024 results
- Plains GP Holdings LP guidance history: guided vs reported
- Plains GP Holdings LP operating margin by quarter
- Plains GP Holdings LP net income by quarter
- Plains GP Holdings LP free cash flow by quarter
- Plains GP Holdings LP capital expenditures by quarter
- Plains GP Holdings LP Product sales revenues revenue by quarter
- Plains GP Holdings LP Services revenues revenue by quarter