Filing Flows

Filing Flows › Real Estate › Equinix (EQIX)

Equinix (EQIX) earnings and revenue breakdown

Latest: Q3 2026 · 10-Q filed Oct 28, 2026 · Equinix (EQIX) Q3 2026 earnings results →

Q3 2026 Revenue up 11% year over year to $2.6B · 19¢ of every $1 of revenue kept as net profit · operating margin 23.3%

Equinix made $2.6B in Q3 2026 (+11% Y/Y): Recurring revenues $2.4B, Non-recurring revenues $129M. Operating margin 23.3%, net earnings $489M. See where every dollar goes — costs, profit and cash — as a Sankey from the 10-Q filed Oct 28, 2026.

Revenue$2.6B
Year over year+11%
Operating margin23.3%
Net earnings$489M
Operating cash flow$1.2B

Drawing the Sankey…

Open the interactive Sankey → click any line for what the company wrote about it, compare Y/Y and Q/Q, export as PNG or PDF

Equinix Q3 2026 revenue breakdown: Sankey diagram of revenue (Recurring revenues, Non-recurring revenues), costs, profit and cash flow
Equinix Q3 2026 revenue breakdown — free to use with credit and a link (terms). Share on X
Embed this chart on your site

Free to use with the credit line. Click a box to select the code.

What changed this quarter

Revenue was $2.6B in Q3 2026, up 11% year over year and down 2% from the previous quarter. Colocation was the largest line at 71% of revenue. Colocation added $0.19B year over year (up 12%), 74% of the total change. Managed infrastructure declined 8%.

Operating profit was $0.60B, a 23.3% margin (up 2.9 points year over year). Of the extra revenue versus Q3 2025, 49% reached operating profit, above the 20% margin then. Total costs grew 7% against revenue growth of 11%. The fastest-growing cost line was Other operating costs (+191%). Net earnings were $0.49B, up 31% year over year. The effective tax rate was 8.9%.

Operating cash flow was $1.2B (up 23% year over year), 254% of net earnings. Non-cash charges added back $0.54B of depreciation and amortization and $0.14B of share-based compensation. Working capital and other items added $0.07B. Capital expenditures of $1.6B exceeded it, leaving free cash flow of −$0.32B.

Quarterly history

Equinix revenue by quarterEquinix revenue by quarter$2.2BQ1 2025$2.3BQ2 2025$2.3BQ3 2025$2.4BQ4 2025$2.4BQ1 2026$2.6BQ2 2026$2.6BQ3 2026
Equinix net earnings by quarterEquinix net earnings by quarter$343MQ1 2025$367MQ2 2025$374MQ3 2025$264MQ4 2025$415MQ1 2026$477MQ2 2026$489MQ3 2026
QuarterFormFiledRevenueY/YOp. marginNet earningsOp. cash flow
Q3 202610-QOct 28, 2026$2.6B+11%23.3%$489M$1.2B
Q2 202610-QJul 29, 2026$2.6B+16%25.3%$477M$1.1B
Q1 202610-QApr 29, 2026$2.4B+10%23.6%$415M$717M
Q4 202510-KFeb 11, 2026$2.4B+7%17.4%$264M$1.1B
Q3 202510-QOct 29, 2025$2.3B+5%20.5%$374M$1.0B
Q2 202510-QJul 30, 2025$2.3B+4%21.9%$367M$944M
Q1 202510-QApr 30, 2025$2.2B+5%20.6%$343M$809M

Charts

Equinix: revenue growth, year over year and quarter over quarterEquinix: revenue growth, year over year and quarter over quarterY/YQ/Q+5%Q1 2025+4%+1%Q2 2025+5%+3%Q3 2025+7%+4%Q4 2025+10%+1%Q1 2026+16%+7%Q2 2026+11%-2%Q3 2026
Latest (Q3 2026): Y/Y +11%, Q/Q -2%.
Equinix: where the cash came from (+) and went (−), TTM to Q3 2026Equinix: where the cash came from (+) and went (−), TTM to Q3 2026Net borrowing (+) / repaid (−)$6.3BCapital spending−$5.8BOperating cash flow$4.2BDividends−$2.0BOther investing−$1.3BReal estate bought−$837MOther financing−$696MAsset & business sales$415MCash drawn (+) / kept (−)−$233MShares issued$90.0MAcquisitions−$69.0MExchange rates−$10.0M
From the cash-flow statement as filed (SEC XBRL). Cash is fungible: the bars do not say which dollar paid for what.
Equinix: profit against cash, quarter by quarterEquinix: profit against cash, quarter by quarterNet incomeOperating cash flow−$14.0M$981MQ4 2024$343M$809MQ1 2025$367M$944MQ2 2025$374M$1.0BQ3 2025$264M$1.1BQ4 2025$415M$717MQ1 2026$477M$1.1BQ2 2026$489M$1.2BQ3 2026
Latest (Q3 2026): Net income $489M, Operating cash flow $1.2B.
Equinix: diluted shares by fiscal yearEquinix: diluted shares by fiscal year88MFY202090MFY202192MFY202294MFY202396MFY202498MFY2025
+11.0% since FY2020: more shares outstanding (issuance, stock pay).
Equinix: long-term debt falling due (FY2025)Equinix: long-term debt falling due (FY2025)$1.3B2026$1.8B2027$1.4B2028$2.2B2029$2.7B2030$9.6BLater
Cash $1.7B, short-term investments $1.5B, long-term debt — at 2025-12-31.
Equinix in its industry: growth against margin (213 companies, SIC 6798)Equinix in its industry: growth against margin (213 companies, SIC 6798)revenue growth, year over year →↑ operating marginmedian +5%median 23%WELLAMTPLDIRMDLRWYVTRSPGBSTTRITMOPSALINEHSTVici Properties L.P.VICIHoward Hughes CorpCCIBoston Properties Ltd PartnershipEXRDOCAvalonbay Communities IncCXWAHRSBACCOLDARERHPHHHLAMRRayonier, L.P.Mid-America Apartments, L.P.SUIMAAKIMKimco Realty OP, LLCSTWDOUTEssex Portfolio LPWPCVornado Realty LPGLPIUDRREGELSPEBSVCAPLESWDRRYNDHCBrixmor Operating Partnership LPRLJStore Capital LLCOHIFederal Realty OP LPFRTDRHCubeSmart, L.P.HRCUBEAHTSL Green Operating Partnership, L.P.SLGKilroy Realty, L.P.KRCJANDEIMACCUZMPT Operating Partnership, L.P.MPTNNNSBRAREXRSTAGADCCDPEPREGPFirst Industrial LPESRTKRGPECOESBAKite Realty Group, L.P.INNCTREIRTEPRTAres Industrial Real Estate Income Trust Inc.SKTZARECBLJBGSHGITBrandywine Operating Partnership, L.P.JLL Income Property Trust, Inc.BNLNHISAFELTCAmerican Assets Trust, L.P.GNLCMRFAATNHPBHRAKRABRDEACLDTLXPBRSPIVTFCPTSMAVinebrook Homes Trust, Inc.Fortress Net Lease REITBFSFBRTUMHALXNTSTFortress Credit Realty Income TrustNXRTCSRNuveen Global Cities REIT, Inc.North Haven Net REITKBSRCottonwood Communities, Inc.CTOSterling Real Estate TrustARIBrookfield Real Estate Income Trust Inc.CLPRXRNSTRWINREPMTNew Mountain Net Lease TrustTRTXJ.P. Morgan Real Estate Income Trust, Inc.ONLCHCTExchangeRight Income FundPSTLCMCTUHTRCFSPCFTR-PAInvesco Real Estate Income Trust Inc.BRTStarwood Credit Real Estate Income TrustWHLRGTJ REIT, Inc.ACRPINEApollo Realty Income Solutions, Inc.NXDTBHMFVRBlackRock Monticello Debt Real Estate Investment TrustLightstone Value Plus REIT I, Inc.Rise Companies CorpSculptor Diversified Real Estate Income Trust, Inc.Lightstone Value Plus REIT II, Inc.Cohen & Steers Income Opportunities REIT, Inc.ACRETCILANDLightstone Value Plus REIT V, Inc.NLCPSACHModiv Industrial, Inc.Fidelity Core Real Estate FundEQT Exeter Real Estate Income Trust, Inc.STSRFPIHighlands REIT, Inc.PRXASITCRreef Property Trust, Inc.LTSVSEVNLightstone Value Plus REIT III, Inc.SGSTFREVSFranklin BSP Real Estate Debt, Inc.BMNMFundrise eREIT, LLCCDR-PBCHMIPrincipal Credit Real Estate Income TrustICR-PANLOPSUNSMKZRGBCSSTLYCPTSQFTSummit Healthcare REIT, IncSELFTPTSGIPRLOANIHTMDRRStratCap Digital Infrastructure REIT, Inc.PWEQIX (+11%, 23%)
Real Estate Investment Trusts; dot size is quarterly revenue; dashed lines are the industry's medians.

In supply chains and themes

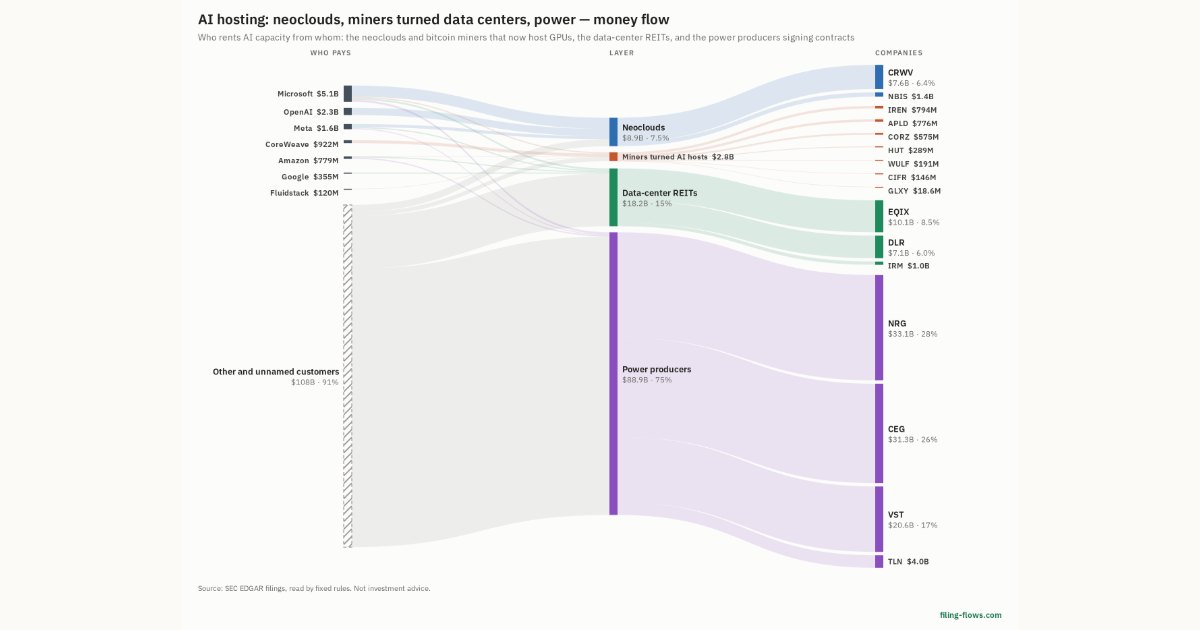
AI hosting: neoclouds, miners turned data centers, power money flowAI hosting: neoclouds, miners turned data centers, power · Data-center REITs

Interactive views

The same charts as the app — open one to draw it.

💵Where each $1 goesinteractive

Loading the interactive chart…

🌏Named in Asian annual reportsinteractive

Loading the interactive chart…

🔄Rotation against the market and its industry (RRG)interactive

Loading the interactive chart…

🔍Earnings qualityinteractive

Loading the interactive chart…

⚖️Fair value by methodinteractive

Loading the interactive chart…

🔭Outlook & guidanceinteractive

Loading the interactive chart…

📈Investments: gains and what it boughtinteractive

Loading the interactive chart…

🏭Its industry’s money flow (input-output)interactive

Loading the interactive chart…

About Equinix

Equinix (Nasdaq: EQIX) is the world's digital infrastructure company, shortening the path to boundless connectivity anywhere in the world to enable the innovations that enrich our work, life and planet. Equinix combines a global footprint of International Business Exchange TM (IBX ® ) and xScale TM data centers in the Americas, Asia-Pacific, and Europe, the Middle East and Africa ("EMEA") regions, infrastructure and interconnection offerings, and digital ecosystems required to serve a large and diverse set of customers around the world.

In its own words, from its 10-K, filed Feb 11, 2026.

Equinix against its Real Estate Investment Trusts peers

The largest companies of the same SEC industry, each at its latest quarter. Revenue growth: +11% against the peers' median +13%. Operating margin: 23.3% against the peers' median 20.6%.

CompanyQuarterRevenueY/YOp. margin
EQIX EquinixQ3 2026$2.6B+11%23.3%
WELL WelltowerQ3 2026$3.7B+38%9.1%
AMT American TowerQ3 2026$2.8B+2%45.6%
PLD PrologisQ1 2026$2.3B+7%52.7%
IRM Iron MountainQ3 2026$2.0B+14%20.6%
DLR Digital Realty TrustQ3 2026$1.9B+21%15.9%
WY WeyerhaeuserQ3 2026$1.9B+8%5.4%
VTR VentasQ3 2026$1.8B+23%2.9%
SPG Simon Property GroupQ3 2026$1.8B+13%44.3%

Source: Equinix 10-Q on SEC EDGAR · CIK 1101239 · Real Estate Investment Trusts

Guidance and outlook

Equinix Revenue: guidance against what was reportedEquinix Revenue: guidance against what was reportedguided rangereported (above / within / below)Q3 2025$2.3BFY2025$9.2BQ4 2025$2.4BFY2026Q1 2026$2.4BQ2 2026$2.6BQ3 2026$2.6BQ4 2026
Met or beat 8 of 9 guided periods. Grey: the last range guided before the figures came out; dot: the reported figure.

13F: who owns EQIX and who is buying

Largest holders of EQIX (13F)Largest holders of EQIX (13F)BlackRock$11.9BVanguard Group$10.3BVanguard Capital Management LLC$6.7BVanguard Portfolio Management LLC$6.4BState Street$6.3BFMR LLC$3.0BGeode Capital Management, LLC$2.6BCohen & Steers$2.3BPrincipal Financial Group$2.0BNorthern Trust$1.6B
Funds' net buying of EQIX by quarter (13F)Funds' net buying of EQIX by quarter (13F)−$377M2024-09−$441M2024-12$329M2025-03−$1.3B2025-06−$491M2025-09$1.3B2025-12$763M2026-03$1.3B2026-06
Value of shares 13F filers added minus the value they sold, each quarter (quarters with most filings in).

More on EQIX

History

Every quarter: Q3 2026 results · Q2 2026 results · Q1 2026 results · Q4 2025 results · Q3 2025 results · Q2 2025 results · Q1 2025 results

Compare EQIX with

中文版:Equinix(EQIX)财报

Español · Français