Filing Flows › Real Estate › Weyerhaeuser (WY)
Weyerhaeuser (WY) earnings and revenue breakdown
Latest: Q3 2026 · 10-Q filed Oct 30, 2026 · Weyerhaeuser (WY) Q3 2026 earnings results →
Q3 2026 Revenue up 8% year over year to $1.9B · 3¢ of every $1 of revenue kept as net profit · operating margin 5.4%
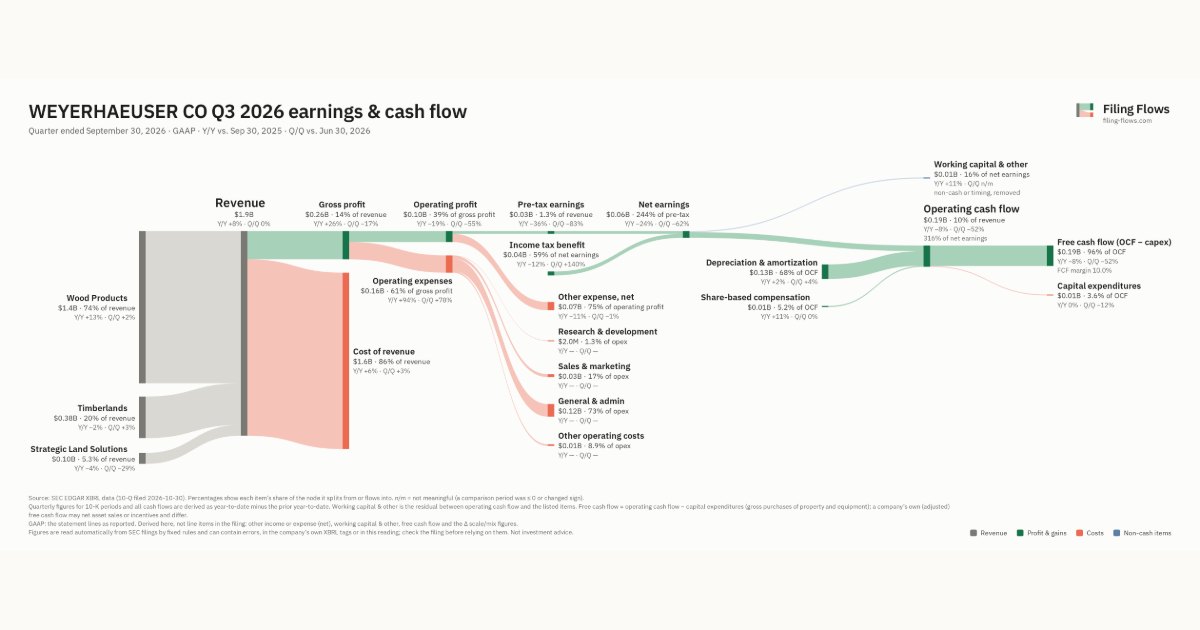
Weyerhaeuser made $1.9B in Q3 2026 (+8% Y/Y): Wood Products $1.4B, Timberlands $378M, Strategic Land Solutions $99.0M. Operating margin 5.4%, net earnings $61.0M. See where every dollar goes — costs, profit and cash — as a Sankey from the 10-Q filed Oct 30, 2026.
Drawing the Sankey…
Open the interactive Sankey → click any line for what the company wrote about it, compare Y/Y and Q/Q, export as PNG or PDF
What changed this quarter
Revenue was $1.9B in Q3 2026, up 8% year over year and roughly flat from the previous quarter. Wood Products was the largest line at 74% of revenue. Wood Products added $0.16B year over year (up 13%), 108% of the total change. Strategic Land Solutions declined 4%.
Gross margin was 13.8%, up 1.9 points from Q3 2025. Operating profit was $0.10B, a 5.4% margin (down 1.8 points year over year). Operating profit fell $0.02B even though revenue rose $0.14B versus Q3 2025, so costs grew faster than sales. Operating expenses grew 94% against revenue growth of 8%. Net earnings were $0.06B, down 24% year over year. The tax line was a benefit of $0.04B on pre-tax earnings of $0.03B.
Operating cash flow was $0.19B (down 8% year over year), 316% of net earnings. Non-cash charges added back $0.13B of depreciation and amortization and $0.01B of share-based compensation. Working capital and other items used $0.01B. Capital expenditures of $0.01B left free cash flow of $0.19B.
Quarterly history
| Quarter | Form | Filed | Revenue | Y/Y | Op. margin | Net earnings | Op. cash flow |
|---|---|---|---|---|---|---|---|
| Q3 2026 | 10-Q | Oct 30, 2026 | $1.9B | +8% | 5.4% | $61.0M | $193M |
| Q2 2026 | 10-Q | Jul 31, 2026 | $1.9B | -0.9% | 11.9% | $162M | $399M |
| Q1 2026 | 10-Q | May 1, 2026 | $1.7B | -2% | 14.3% | $156M | $52.0M |
| Q4 2025 | 10-K | Feb 13, 2026 | $1.5B | -10% | 16.3% | $74.0M | −$114M |
| Q3 2025 | 10-Q | Oct 31, 2025 | $1.7B | +2% | 7.2% | $80.0M | $210M |
| Q2 2025 | 10-Q | Jul 25, 2025 | $1.9B | -3% | 9.4% | $87.0M | $396M |
| Q1 2025 | 10-Q | Apr 25, 2025 | $1.8B | -2% | 10.2% | $83.0M | $70.0M |
Charts
Interactive views
The same charts as the app — open one to draw it.
💵Where each $1 goesinteractive
Loading the interactive chart…
🌏Named in Asian annual reportsinteractive
Loading the interactive chart…
🔄Rotation against the market and its industry (RRG)interactive
Loading the interactive chart…
🔍Earnings qualityinteractive
Loading the interactive chart…
⚖️Fair value by methodinteractive
Loading the interactive chart…
🔭Outlook & guidanceinteractive
Loading the interactive chart…
📈Investments: gains and what it boughtinteractive
Loading the interactive chart…
🏭Its industry’s money flow (input-output)interactive
Loading the interactive chart…
About Weyerhaeuser
Weyerhaeuser Company, one of the world's largest private owners of timberlands, began operations in 1900 and today owns or controls more than 10 million acres of timberlands in the U.S., as well as additional public timberlands managed under long-term licenses in Canada. Weyerhaeuser has been a global leader in sustainability for more than a century and manages 100 percent of its timberlands on a fully sustainable basis in compliance with internationally recognized sustainable forestry standards. Weyerhaeuser is also one of the largest manufacturers of wood products in North America and operates additional business lines around product distribution, climate solutions, real estate, and energy and natural resources, among others. In 2025, the company generated $6.9 billion in net sales and employed approximately 9,500 people who serve customers worldwide.
In its own words, from its 8-K, filed Jul 30, 2026.
Weyerhaeuser against its Real Estate Investment Trusts peers
The largest companies of the same SEC industry, each at its latest quarter. Revenue growth: +8% against the peers' median +13%. Operating margin: 5.4% against the peers' median 20.6%.
| Company | Quarter | Revenue | Y/Y | Op. margin |
|---|---|---|---|---|
| WY Weyerhaeuser | Q3 2026 | $1.9B | +8% | 5.4% |
| WELL Welltower | Q3 2026 | $3.7B | +38% | 9.1% |
| AMT American Tower | Q3 2026 | $2.8B | +2% | 45.6% |
| EQIX Equinix | Q3 2026 | $2.6B | +11% | 23.3% |
| PLD Prologis | Q1 2026 | $2.3B | +7% | 52.7% |
| IRM Iron Mountain | Q3 2026 | $2.0B | +14% | 20.6% |
| DLR Digital Realty Trust | Q3 2026 | $1.9B | +21% | 15.9% |
| VTR Ventas | Q3 2026 | $1.8B | +23% | 2.9% |
| SPG Simon Property Group | Q3 2026 | $1.8B | +13% | 44.3% |
Source: Weyerhaeuser 10-Q on SEC EDGAR · CIK 106535 · Real Estate Investment Trusts
Guidance and outlook
13F: who owns WY and who is buying
More on WY
- How Weyerhaeuser makes money: revenue by segment
- Weyerhaeuser next earnings date and what analysts expect
- Weyerhaeuser stock forecast, price target and fair value
- Who owns Weyerhaeuser stock: holders, funds and Congress trades
- Weyerhaeuser guidance and outlook
- Weyerhaeuser recalls, complaints and regulation
History
Every quarter: Q3 2026 results · Q2 2026 results · Q1 2026 results · Q4 2025 results · Q3 2025 results · Q2 2025 results · Q1 2025 results
- Weyerhaeuser guidance history: guided vs reported
- Weyerhaeuser gross margin by quarter
- Weyerhaeuser operating margin by quarter
- Weyerhaeuser net income by quarter
- Weyerhaeuser free cash flow by quarter
- Weyerhaeuser R&D spending by quarter
- Weyerhaeuser capital expenditures by quarter
- Weyerhaeuser Wood Products revenue by quarter
- Weyerhaeuser Timberlands revenue by quarter
- Weyerhaeuser Strategic Land Solutions revenue by quarter