Filing Flows › Industrials › Comfort Systems USA (FIX)
Comfort Systems USA (FIX) earnings and revenue breakdown
Latest: Q3 2026 · 10-Q filed Oct 22, 2026 · Comfort Systems USA (FIX) Q3 2026 earnings results →
Q3 2026 Revenue up 54% year over year to $3.8B · 13¢ of every $1 of revenue kept as net profit · operating margin 16.6%
Comfort Systems USA made $3.8B in Q3 2026 (+54% Y/Y): New construction $2.9B, Existing building construction $528M, Service projects $191M. Operating margin 16.6%, net earnings $489M. See where every dollar goes — costs, profit and cash — as a Sankey from the 10-Q filed Oct 22, 2026.
Drawing the Sankey…
Open the interactive Sankey → click any line for what the company wrote about it, compare Y/Y and Q/Q, export as PNG or PDF
What changed this quarter
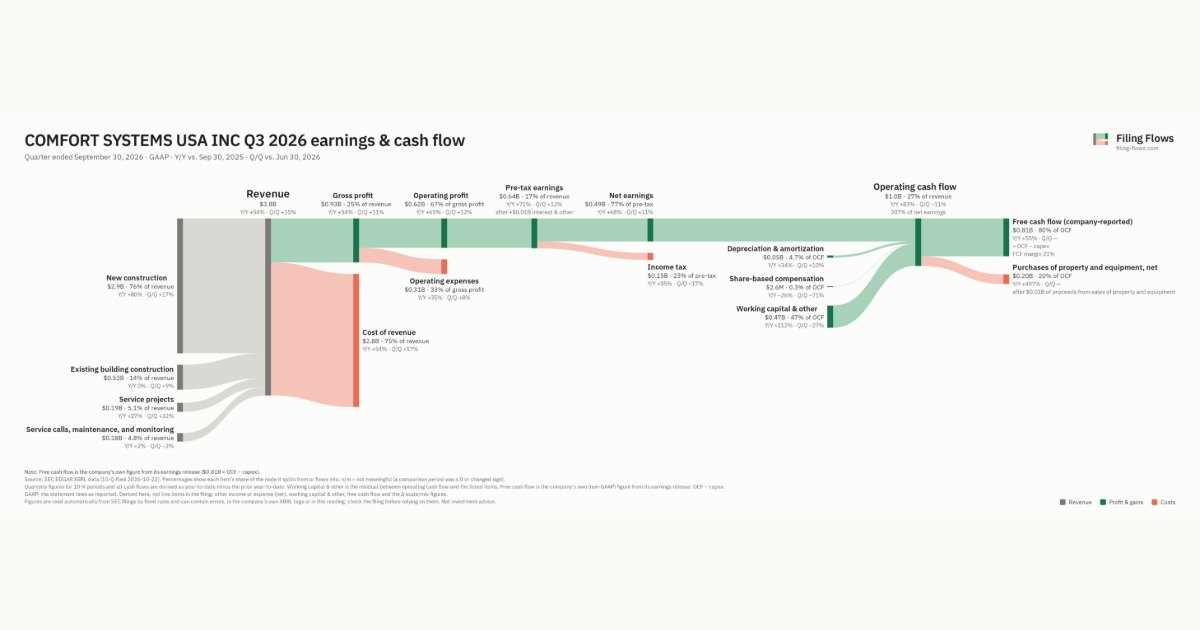
Revenue was $3.8B in Q3 2026, up 54% year over year and up 15% from the previous quarter. New construction was the largest line at 76% of revenue. New construction added $1.3B year over year (up 80%), 97% of the total change.
Gross margin was 24.8%, unchanged from Q3 2025. Operating profit was $0.62B, a 16.6% margin (up 1.1 points year over year). Of the extra revenue versus Q3 2025, 19% reached operating profit, above the 15% margin then. Operating expenses grew 35% against revenue growth of 54%. Net earnings were $0.49B, up 68% year over year. The effective tax rate was 23.0%.
Operating cash flow was $1.0B (up 83% year over year), 207% of net earnings. Non-cash charges added back $0.05B of depreciation and amortization and $2.6M of share-based compensation. Working capital and other items added $0.47B. After purchases of property and equipment, net ($0.20B), free cash flow as the company reports it was $0.81B.
Quarterly history
| Quarter | Form | Filed | Revenue | Y/Y | Op. margin | Net earnings | Op. cash flow |
|---|---|---|---|---|---|---|---|
| Q3 2026 | 10-Q | Oct 22, 2026 | $3.8B | +54% | 16.6% | $489M | $1.0B |
| Q2 2026 | 10-Q | Jul 23, 2026 | $3.3B | +50% | 17.1% | $442M | $1.1B |
| Q1 2026 | 10-Q | Apr 23, 2026 | $2.9B | +56% | 17.0% | $370M | $389M |
| Q4 2025 | 10-K | Feb 19, 2026 | $2.6B | +42% | 16.1% | $331M | $469M |
| Q3 2025 | 10-Q | Oct 23, 2025 | $2.5B | +35% | 15.5% | $292M | $553M |
| Q2 2025 | 10-Q | Jul 24, 2025 | $2.2B | +20% | 13.8% | $231M | $252M |
| Q1 2025 | 10-Q | Apr 24, 2025 | $1.8B | +19% | 11.4% | $169M | −$88.0M |
Charts
In supply chains and themes
Interactive views
The same charts as the app — open one to draw it.
💵Where each $1 goesinteractive
Loading the interactive chart…
🌏Named in Asian annual reportsinteractive
Loading the interactive chart…
🔄Rotation against the market and its industry (RRG)interactive
Loading the interactive chart…
🔍Earnings qualityinteractive
Loading the interactive chart…
⚖️Fair value by methodinteractive
Loading the interactive chart…
🔭Outlook & guidanceinteractive
Loading the interactive chart…
📈Investments: gains and what it boughtinteractive
Loading the interactive chart…
🏭Its industry’s money flow (input-output)interactive
Loading the interactive chart…
About Comfort Systems USA
Comfort Systems USA, Inc., a Delaware corporation, was established in 1997. We provide mechanical and electrical contracting services. Our mechanical segment principally includes heating, ventilation and air conditioning (“HVAC”), plumbing, piping and controls, as well as off-site construction, monitoring and fire protection. Our electrical segment includes installation and servicing of electrical systems. We build, install, maintain, repair and replace mechanical, electrical and plumbing (“MEP”) systems through our 50 operating units with 190 locations in 142 cities throughout the United States.
In its own words, from its 10-K, filed Feb 19, 2026.
Comfort Systems USA against its Electrical Work peers
The largest companies of the same SEC industry, each at its latest quarter. Revenue growth: +54% against the peers' median +54%. Operating margin: 16.6% against the peers' median 14.4%.
| Company | Quarter | Revenue | Y/Y | Op. margin |
|---|---|---|---|---|
| FIX Comfort Systems USA | Q3 2026 | $3.8B | +54% | 16.6% |
| PWR Quanta Services | Q3 2026 | $12.0B | +57% | 8.5% |
| EME EMCOR Group | Q3 2026 | $5.5B | +29% | 9.8% |
| IESC IES Holdings | Q3 FY26 | $1.2B | +40% | 14.4% |
Source: Comfort Systems USA 10-Q on SEC EDGAR · CIK 1035983 · Electrical Work
13F: who owns FIX and who is buying
More on FIX
History
Every quarter: Q3 2026 results · Q2 2026 results · Q1 2026 results · Q4 2025 results · Q3 2025 results · Q2 2025 results · Q1 2025 results
- Comfort Systems USA gross margin by quarter
- Comfort Systems USA operating margin by quarter
- Comfort Systems USA net income by quarter
- Comfort Systems USA free cash flow by quarter
- Comfort Systems USA capital expenditures by quarter
- Comfort Systems USA New construction revenue by quarter
- Comfort Systems USA Existing building construction revenue by quarter
- Comfort Systems USA Service projects revenue by quarter