Filing Flows › Industrials › EMCOR Group (EME)
EMCOR Group (EME) earnings and revenue breakdown
Latest: Q3 2026 · 10-Q filed Oct 29, 2026 · EMCOR Group (EME) Q3 2026 earnings results →
Q3 2026 Revenue up 29% year over year to $5.5B · 7¢ of every $1 of revenue kept as net profit · operating margin 9.8%
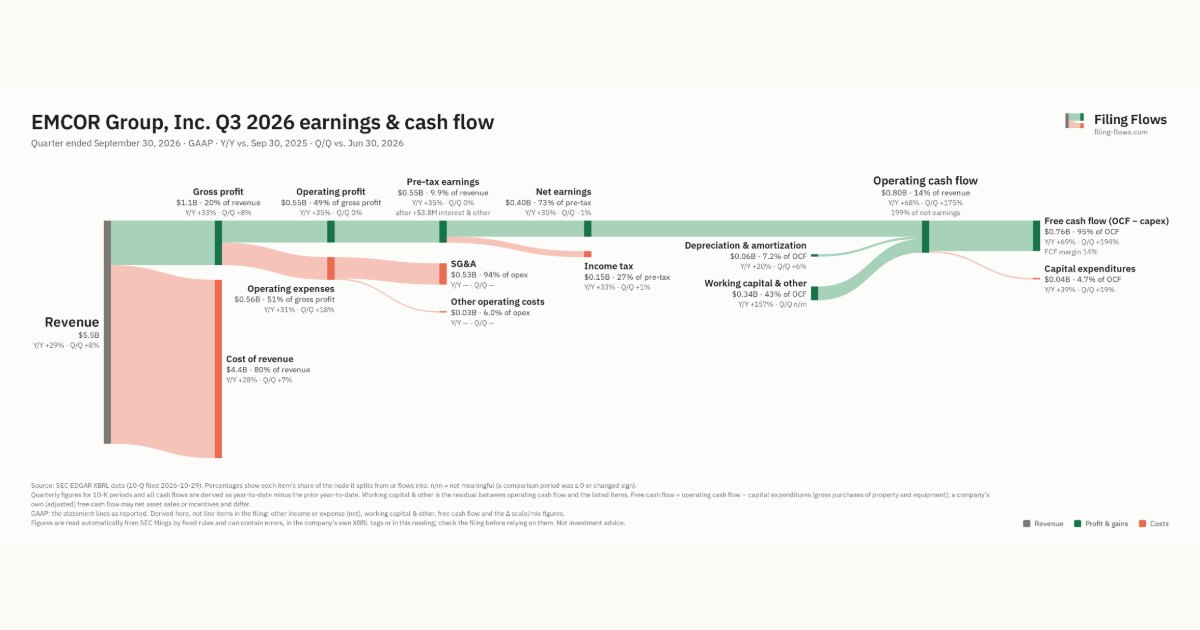
EMCOR Group made $5.5B in Q3 2026 (+29% Y/Y). Operating margin 9.8%, net earnings $400M. See where every dollar goes — costs, profit and cash — as a Sankey from the 10-Q filed Oct 29, 2026.
Drawing the Sankey…
Open the interactive Sankey → click any line for what the company wrote about it, compare Y/Y and Q/Q, export as PNG or PDF
What changed this quarter
Revenue was $5.5B in Q3 2026, up 29% year over year and up 8% from the previous quarter.
Gross margin was 20.0%, up 0.6 points from Q3 2025. Operating profit was $0.55B, a 9.8% margin (up 0.4 points year over year). Of the extra revenue versus Q3 2025, 11% reached operating profit, above the 9% margin then. Operating expenses grew 31% against revenue growth of 29%. Net earnings were $0.40B, up 35% year over year. The effective tax rate was 27.2%.
Operating cash flow was $0.80B (up 68% year over year), 199% of net earnings. Non-cash charges added back $0.06B of depreciation and amortization. Working capital and other items added $0.34B. Capital expenditures of $0.04B left free cash flow of $0.76B.
Quarterly history
| Quarter | Form | Filed | Revenue | Y/Y | Op. margin | Net earnings | Op. cash flow |
|---|---|---|---|---|---|---|---|
| Q3 2026 | 10-Q | Oct 29, 2026 | $5.5B | +29% | 9.8% | $400M | $797M |
| Q2 2026 | 10-Q | Jul 30, 2026 | $5.2B | +20% | 10.6% | $404M | $289M |
| Q1 2026 | 10-Q | Apr 29, 2026 | $4.6B | +20% | 8.7% | $305M | $558K |
| Q4 2025 | 10-K | Feb 26, 2026 | $4.5B | +20% | 12.7% | $435M | $524M |
| Q3 2025 | 10-Q | Oct 30, 2025 | $4.3B | +16% | 9.4% | $295M | $476M |
| Q2 2025 | 10-Q | Jul 31, 2025 | $4.3B | +17% | 9.6% | $302M | $194M |
| Q1 2025 | 10-Q | Apr 30, 2025 | $3.9B | +13% | 8.2% | $241M | $108M |
Charts
In supply chains and themes
Interactive views
The same charts as the app — open one to draw it.
💵Where each $1 goesinteractive
Loading the interactive chart…
🌏Named in Asian annual reportsinteractive
Loading the interactive chart…
🔄Rotation against the market and its industry (RRG)interactive
Loading the interactive chart…
🔍Earnings qualityinteractive
Loading the interactive chart…
⚖️Fair value by methodinteractive
Loading the interactive chart…
🔭Outlook & guidanceinteractive
Loading the interactive chart…
📈Investments: gains and what it boughtinteractive
Loading the interactive chart…
🏭Its industry’s money flow (input-output)interactive
Loading the interactive chart…
About EMCOR Group
References to the “Company,” “EMCOR,” “we,” “us,” “our” and similar words refer to EMCOR Group, Inc. and its consolidated subsidiaries unless the context indicates otherwise. We are one of the largest specialty contractors in the United States and a leading provider of electrical and mechanical construction and facilities services, building services, and industrial services. In 2025, we had revenues of $16.99 billion. Our services are provided to a broad range of commercial, technology, manufacturing, industrial, healthcare, utility, and institutional customers through approximately 100 operating subsidiaries, which specialize principally in providing construction services relating to electrical and mechanical systems in all types of facilities and in providing various services relating to the operation, maintenance, and management of those facilities.
In its own words, from its 10-K, filed Feb 26, 2026.
EMCOR Group against its Electrical Work peers
The largest companies of the same SEC industry, each at its latest quarter. Revenue growth: +29% against the peers' median +54%. Operating margin: 9.8% against the peers' median 14.4%.
| Company | Quarter | Revenue | Y/Y | Op. margin |
|---|---|---|---|---|
| EME EMCOR Group | Q3 2026 | $5.5B | +29% | 9.8% |
| PWR Quanta Services | Q3 2026 | $12.0B | +57% | 8.5% |
| FIX Comfort Systems USA | Q3 2026 | $3.8B | +54% | 16.6% |
| IESC IES Holdings | Q3 FY26 | $1.2B | +40% | 14.4% |
Source: EMCOR Group 10-Q on SEC EDGAR · CIK 105634 · Electrical Work
Guidance and outlook
13F: who owns EME and who is buying
More on EME
History
Every quarter: Q3 2026 results · Q2 2026 results · Q1 2026 results · Q4 2025 results · Q3 2025 results · Q2 2025 results · Q1 2025 results