Filing Flows › Industrials › Graham Holdings (GHC)
Graham Holdings (GHC) earnings and revenue breakdown
Latest: Q3 2026 · 10-Q filed Oct 29, 2026 · Graham Holdings (GHC) Q3 2026 earnings results →
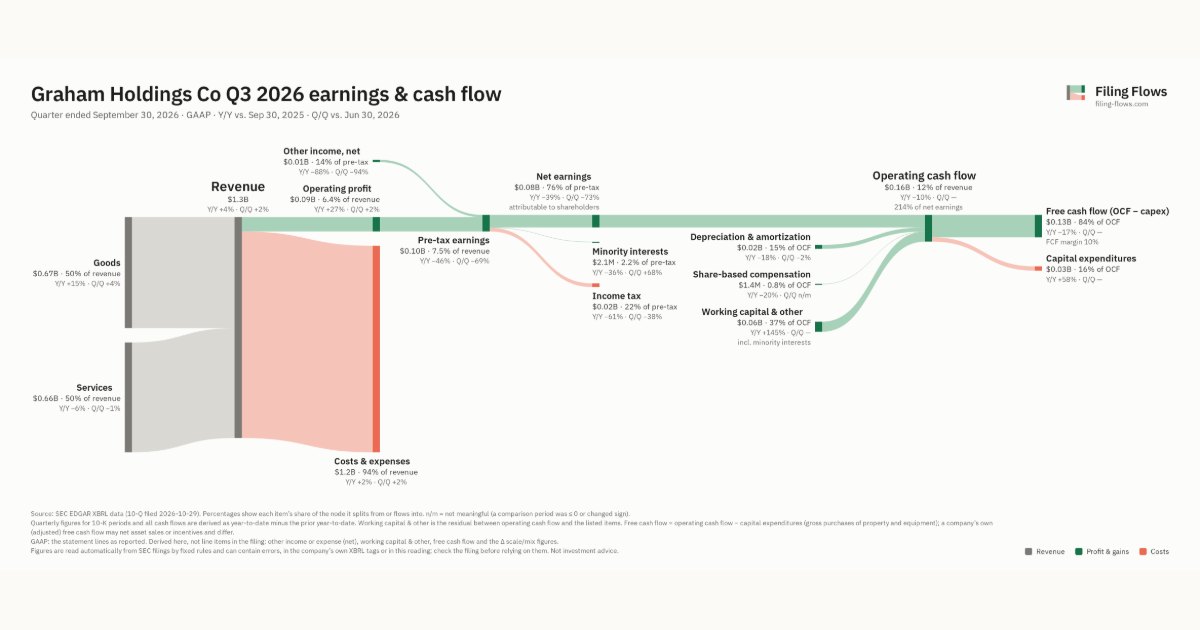
Q3 2026 Revenue up 4% year over year to $1.3B · 6¢ of every $1 of revenue kept as net profit · operating margin 6.4%
Graham Holdings made $1.3B in Q3 2026 (+4% Y/Y): Goods $666M, Services $660M. Operating margin 6.4%, net earnings $75.1M. See where every dollar goes — costs, profit and cash — as a Sankey from the 10-Q filed Oct 29, 2026.
Drawing the Sankey…
Open the interactive Sankey → click any line for what the company wrote about it, compare Y/Y and Q/Q, export as PNG or PDF
What changed this quarter
Revenue was $1.3B in Q3 2026, up 4% year over year and up 2% from the previous quarter. Goods was the largest line at 50% of revenue. Goods added $0.09B year over year (up 15%), 186% of the total change. Services declined 6%.
Operating profit was $0.09B, a 6.4% margin (up 1.2 points year over year). Of the extra revenue versus Q3 2025, 39% reached operating profit, above the 5% margin then. Total costs grew 2% against revenue growth of 4%. Net earnings were $0.08B, down 39% year over year. The effective tax rate was 22.1%.
Operating cash flow was $0.16B (down 10% year over year), 208% of net income including minority interests. Non-cash charges added back $0.02B of depreciation and amortization and $1.4M of share-based compensation. Working capital and other items added $0.06B. Capital expenditures of $0.03B left free cash flow of $0.13B.
Quarterly history
| Quarter | Form | Filed | Revenue | Y/Y | Op. margin | Net earnings | Op. cash flow |
|---|---|---|---|---|---|---|---|
| Q3 2026 | 10-Q | Oct 29, 2026 | $1.3B | +4% | 6.4% | $75.1M | $160M |
| Q2 2026 | 10-Q | Jul 30, 2026 | $1.3B | +7% | 6.4% | $281M | — |
| Q4 2025 | 10-K | Feb 25, 2026 | $1.3B | +0.4% | 3.8% | $109M | $28.3M |
| Q3 2025 | 10-Q | Oct 29, 2025 | $1.3B | +6% | 5.2% | $123M | $178M |
| Q2 2025 | 10-Q | Jul 30, 2025 | $1.2B | +3% | 6.0% | $36.7M | $94.8M |
| Q1 2025 | 10-Q | Apr 30, 2025 | $1.2B | +1% | 4.1% | $23.9M | $46.0M |
| Q4 2024 | 10-K | Feb 26, 2025 | $1.2B | +7% | 5.8% | $549M | $116M |
Charts
Interactive views
The same charts as the app — open one to draw it.
💵Where each $1 goesinteractive
Loading the interactive chart…
🌏Named in Asian annual reportsinteractive
Loading the interactive chart…
🔄Rotation against the market and its industry (RRG)interactive
Loading the interactive chart…
🔍Earnings qualityinteractive
Loading the interactive chart…
⚖️Fair value by methodinteractive
Loading the interactive chart…
🔭Outlook & guidanceinteractive
Loading the interactive chart…
📈Investments: gains and what it boughtinteractive
Loading the interactive chart…
🏭Its industry’s money flow (input-output)interactive
Loading the interactive chart…
About Graham Holdings
Graham Holdings Company (the Company) is a diversified holding company whose operations include educational services, television broadcasting, manufacturing, healthcare, automotive dealerships and other businesses. Through Kaplan, Inc. (Kaplan), the Company provides a wide variety of educational services to students, schools, colleges, universities and businesses, both domestically and outside the United States (U.S.). Kaplan’s educational services include academic preparation programs for international students, English-language programs, operations support services for pre-college, certificate, undergraduate and graduate programs, exam preparation for high school and graduate students and for professional certifications and licensures, career and academic advisement services to businesses, and a United Kingdom (U.K.) sixth-form college that prepares students for A-level examinations.
In its own words, from its 10-K, filed Feb 25, 2026.
Graham Holdings against its Services-Educational Services peers
The largest companies of the same SEC industry, each at its latest quarter. Revenue growth: +4% against the peers' median +4%. Operating margin: 6.4% against the peers' median 12.0%.
| Company | Quarter | Revenue | Y/Y | Op. margin |
|---|---|---|---|---|
| GHC Graham Holdings | Q3 2026 | $1.3B | +4% | 6.4% |
| BSAA Best SPAC I Acquisition | Q1 2026 | $1.2B | — | 0.0% |
| LRN Stride | Q1 FY27 | $639M | +3% | 13.2% |
| CVSA Covista | Q1 FY27 | $512M | +11% | 19.2% |
| LAUR Laureate Education | Q3 2026 | $485M | +21% | 24.6% |
| STRA Strategic Education | Q3 2026 | $325M | +2% | -26.9% |
| LOPE Grand Canyon Education | Q3 2026 | $267M | +2% | 19.3% |
| PXED Phoenix Education Partners | Q4 FY26 | $261M | +1% | 12.0% |
| UTI Universal Technical Institute | Q3 FY26 | $219M | +7% | 1.5% |
Source: Graham Holdings 10-Q on SEC EDGAR · CIK 104889 · Services-Educational Services
13F: who owns GHC and who is buying
More on GHC
History
Every quarter: Q3 2026 results · Q2 2026 results · Q4 2025 results · Q3 2025 results · Q2 2025 results · Q1 2025 results · Q4 2024 results