Filing Flows › Financials › Iren (IREN)
Iren (IREN) earnings and revenue breakdown
Latest: Q1 FY27 · 10-Q filed Nov 5, 2026 · Iren (IREN) Q1 FY27 earnings results →
Q1 FY27 Revenue down 5% year over year to $228M · 115¢ of every $1 of revenue lost · operating margin -81.6%
Iren made $228M in Q1 FY27 (-5% Y/Y): AI Cloud Services $135M, AI Cloud Lease $65.0M, Other revenues $28.0M. Operating margin -81.6%, net loss $263M. See where every dollar goes — costs, profit and cash — as a Sankey from the 10-Q filed Nov 5, 2026.
Drawing the Sankey…
Open the interactive Sankey → click any line for what the company wrote about it, compare Y/Y and Q/Q, export as PNG or PDF
What changed this quarter
Revenue was $228.0M in Q1 FY27, down 5% year over year and up 66% from the previous quarter. AI Cloud Services was the largest line at 59% of revenue.
Operating costs exceeded revenue by $186.0M, an operating margin of -81.6%. Total costs grew 31% against a revenue fall of 5%. The fastest-growing cost line was SG&A (+57%). The quarter ended with a net loss of $263.0M, narrower than the previous quarter's $684.0M loss.
Operating cash flow was $529.0M (up 273% year over year). Non-cash charges added back $148.0M of depreciation and amortization and $106.0M of share-based compensation. Working capital and other items added $538.0M. Capital expenditures of $2,131.0M exceeded it, leaving free cash flow of −$1,602.0M.
Quarterly history
| Quarter | Form | Filed | Revenue | Y/Y | Op. margin | Net earnings | Op. cash flow |
|---|---|---|---|---|---|---|---|
| Q1 FY27 | 10-Q | Nov 5, 2026 | $228M | -5% | -81.6% | −$263M | $529M |
| Q4 FY26 | 10-K | Aug 27, 2026 | $137M | -27% | -452.1% | −$684M | $1.8B |
| Q3 FY26 | 10-Q | May 8, 2026 | $145M | 0% | -161.3% | −$248M | $75.3M |
| Q2 FY26 | 10-Q | Feb 5, 2026 | $185M | +59% | -63.0% | −$155M | $71.7M |
| Q1 FY26 | 10-Q | Nov 6, 2025 | $240M | +355% | -31.8% | $385M | $142M |
| Q4 FY25 | 10-K | Aug 28, 2025 | $187M | — | 9.6% | $177M | $103M |
Charts
In supply chains and themes
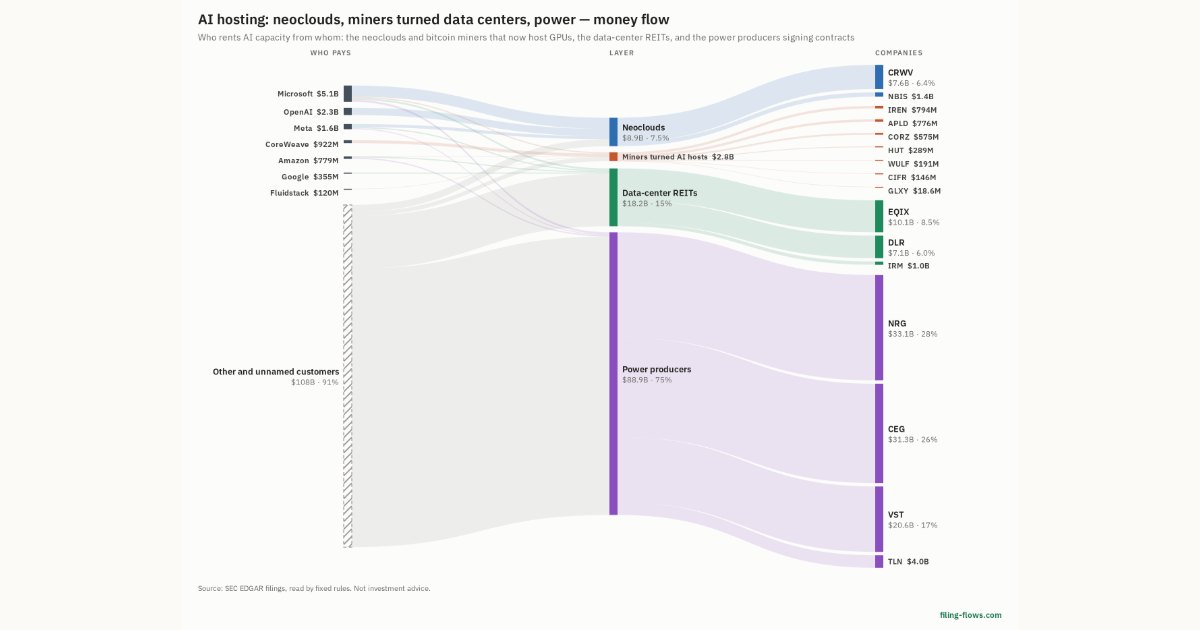
Interactive views
The same charts as the app — open one to draw it.
💵Where each $1 goesinteractive
Loading the interactive chart…
🌏Named in Asian annual reportsinteractive
Loading the interactive chart…
🔄Rotation against the market and its industry (RRG)interactive
Loading the interactive chart…
🔍Earnings qualityinteractive
Loading the interactive chart…
⚖️Fair value by methodinteractive
Loading the interactive chart…
🔭Outlook & guidanceinteractive
Loading the interactive chart…
📈Investments: gains and what it boughtinteractive
Loading the interactive chart…
🏭Its industry’s money flow (input-output)interactive
Loading the interactive chart…
About Iren
IREN is a vertically integrated AI Cloud Services platform, delivering data centers, compute and software for AI training and inference. We own and operate all three layers of the AI Cloud Services stack: the data center layer, the compute layer and the software layer.
In its own words, from its 10-K, filed Aug 27, 2026.
Iren against its Finance Services peers
The largest companies of the same SEC industry, each at its latest quarter. Revenue growth: -5% against the peers' median +17%. Operating margin: -81.6% against the peers' median 5.1%.
| Company | Quarter | Revenue | Y/Y | Op. margin |
|---|---|---|---|---|
| IREN Iren | Q1 FY27 | $228M | -5% | -81.6% |
| AXP American Express | Q3 2026 | $20.1B | +9% | 22.6% |
| BTGO Bitgo Holdings | Q2 FY27 | $4.3B | +80% | -0.4% |
| General Motors Financial Company | Q3 2026 | $4.3B | -0.6% | 15.3% |
| SOFI SoFi Technologies | Q3 2026 | $1.4B | +44% | 22.9% |
| COIN Coinbase Global | Q3 2026 | $1.2B | -35% | 5.1% |
| CRCL Circle Internet Group | Q3 2026 | $865M | +17% | 24.1% |
| CHYM Chime Financial | Q3 2026 | $718M | +32% | 4.8% |
| GDOT Green DOT | Q2 2026 | $596M | +18% | -0.1% |
Source: Iren 10-Q on SEC EDGAR · CIK 1878848 · Finance Services
Guidance and outlook
More on IREN
History
Every quarter: Q1 FY27 results · Q4 FY26 results · Q3 FY26 results · Q2 FY26 results · Q1 FY26 results · Q4 FY25 results