Filing Flows › Consumer Discretionary › Lucid Group (LCID)
Lucid Group (LCID) earnings and revenue breakdown
Latest: Q2 2026 · 10-Q filed Aug 4, 2026 · Lucid Group (LCID) Q2 2026 earnings results →
Q2 2026 Revenue up 56% year over year to $405M · 255¢ of every $1 of revenue lost · operating margin -267.0%
Lucid Group made $405M in Q2 2026 (+56% Y/Y). Operating margin -267.0%, net loss $1.0B. See where every dollar goes — costs, profit and cash — as a Sankey from the 10-Q filed Aug 4, 2026.
Drawing the Sankey…
Open the interactive Sankey → click any line for what the company wrote about it, compare Y/Y and Q/Q, export as PNG or PDF
What changed this quarter
Revenue was $405.3M in Q2 2026, up 56% year over year and up 44% from the previous quarter.
Operating costs exceeded revenue by $1,082.2M, an operating margin of -267.0%. Total costs grew 40% against revenue growth of 56%. The fastest-growing cost line was Cost of revenue (+56%). The quarter ended with a net loss of $1,034.9M, wider than the previous quarter's $1,028.3M loss.
Operating cash flow was −$1,222.2M. Non-cash charges added back $122.2M of depreciation and amortization and $46.6M of share-based compensation. Working capital and other items used $356.2M. Capital expenditures of $253.8M exceeded it, leaving free cash flow of −$1,476.1M.
Quarterly history
| Quarter | Form | Filed | Revenue | Y/Y | Op. margin | Net earnings | Op. cash flow |
|---|---|---|---|---|---|---|---|
| Q2 2026 | 10-Q | Aug 4, 2026 | $405M | +56% | -267.0% | −$1.0B | −$1.2B |
| Q1 2026 | 10-Q | May 5, 2026 | $282M | +20% | -350.3% | −$1.0B | −$1.2B |
| Q4 2025 | 10-K | Feb 24, 2026 | $523M | +123% | -203.7% | −$814M | −$916M |
| Q3 2025 | 10-Q | Nov 5, 2025 | $337M | +68% | -279.9% | −$978M | −$757M |
| Q2 2025 | 10-Q | Aug 5, 2025 | $259M | +29% | -309.5% | −$539M | −$830M |
| Q1 2025 | 10-Q | May 6, 2025 | $235M | +36% | -294.4% | −$366M | −$429M |
| Q4 2024 | 10-K | Feb 25, 2025 | $234M | +49% | -312.6% | −$397M | −$533M |
Charts
In supply chains and themes
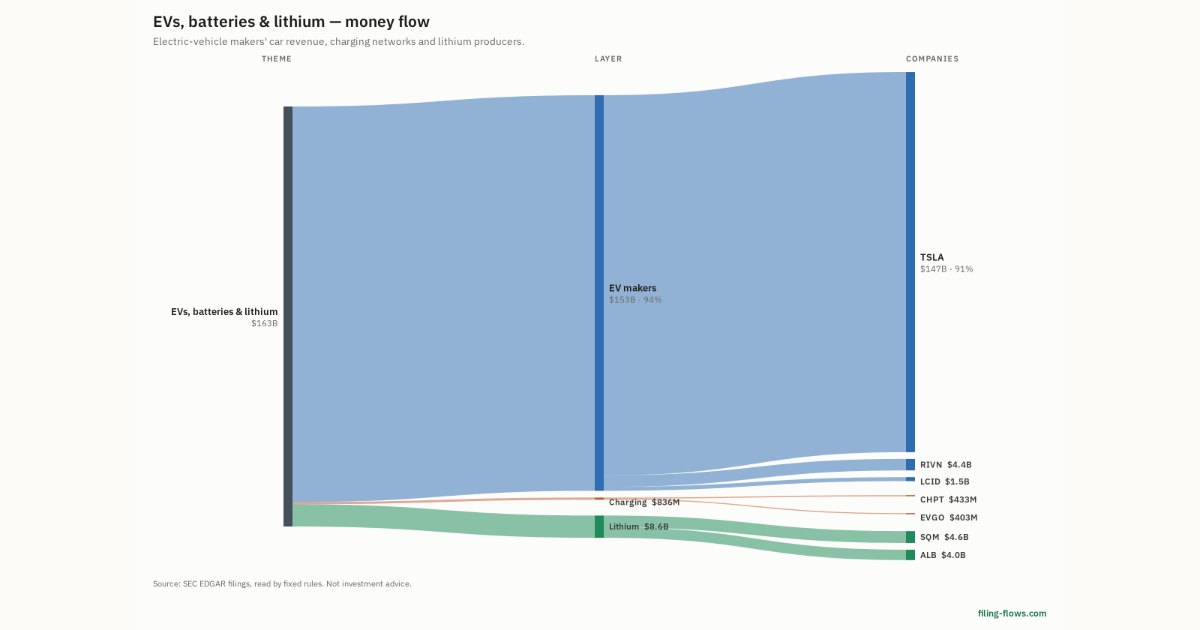
Interactive views
The same charts as the app — open one to draw it.
💵Where each $1 goesinteractive
Loading the interactive chart…
🌏Named in Asian annual reportsinteractive
Loading the interactive chart…
🔄Rotation against the market and its industry (RRG)interactive
Loading the interactive chart…
🔍Earnings qualityinteractive
Loading the interactive chart…
⚖️Fair value by methodinteractive
Loading the interactive chart…
🔭Outlook & guidanceinteractive
Loading the interactive chart…
📈Investments: gains and what it boughtinteractive
Loading the interactive chart…
🏭Its industry’s money flow (input-output)interactive
Loading the interactive chart…
About Lucid Group
Lucid is a technology company that is shaping the future of mobility through its innovations, advanced technology, and software-defined vehicle platforms. The company’s award-winning Lucid Air and Lucid Gravity set new standards with their unmatched combination of performance, range, space, and efficiency. Additionally, through our collaboration with leading market and technology partners, Lucid is leveraging its advanced software and hardware architecture to power the next generation of advanced driver assistance system (“ADAS”) and true eyes-off, hands-off, and mind-off (“Level 4”) autonomous mobility systems for consumer and ride-hailing applications.
In its own words, from its 10-K, filed Feb 24, 2026.
Lucid Group against its Motor Vehicles & Passenger Car Bodies peers
The largest companies of the same SEC industry, each at its latest quarter. Revenue growth: +56% against the peers' median +6%. Operating margin: -267.0% against the peers' median 2.9%.
| Company | Quarter | Revenue | Y/Y | Op. margin |
|---|---|---|---|---|
| LCID Lucid Group | Q2 2026 | $405M | +56% | -267.0% |
| GM General Motors | Q3 2026 | $50.0B | +3% | 7.2% |
| F Ford Motor | Q3 2026 | $49.5B | -2% | 2.9% |
| TSLA Tesla | Q3 2026 | $28.0B | -0.2% | 2.6% |
| PCAR Paccar | Q3 2026 | $7.9B | +19% | 13.6% |
| OSK Oshkosh | Q3 2026 | $2.8B | +6% | 6.9% |
| RIVN Rivian Automotive | Q3 2026 | $2.2B | +38% | -40.9% |
| FSS Federal Signal | Q3 2026 | $656M | +18% | 17.0% |
| CENN Cenntro | Q2 2026 | $6.2M | -3% | -120.5% |
Source: Lucid Group 10-Q on SEC EDGAR · CIK 1811210 · Motor Vehicles & Passenger Car Bodies
13F: who owns LCID and who is buying
More on LCID
- How Lucid Group makes money: revenue by segment
- Lucid Group next earnings date and what analysts expect
- Lucid Group stock forecast, price target and fair value
- Who owns Lucid Group stock: holders, funds and Congress trades
- Is Lucid Group a takeover target? LBO and rumors
- Lucid Group recalls, complaints and regulation
History
Every quarter: Q2 2026 results · Q1 2026 results · Q4 2025 results · Q3 2025 results · Q2 2025 results · Q1 2025 results · Q4 2024 results