Filing Flows › Consumer Discretionary › Tesla (TSLA)
Tesla (TSLA) earnings and revenue breakdown
Latest: Q3 2026 · 10-Q filed Oct 22, 2026 · Tesla (TSLA) Q3 2026 earnings results →
Q3 2026 Revenue down 0% year over year to $28.0B · 3¢ of every $1 of revenue kept as net profit · operating margin 2.6%
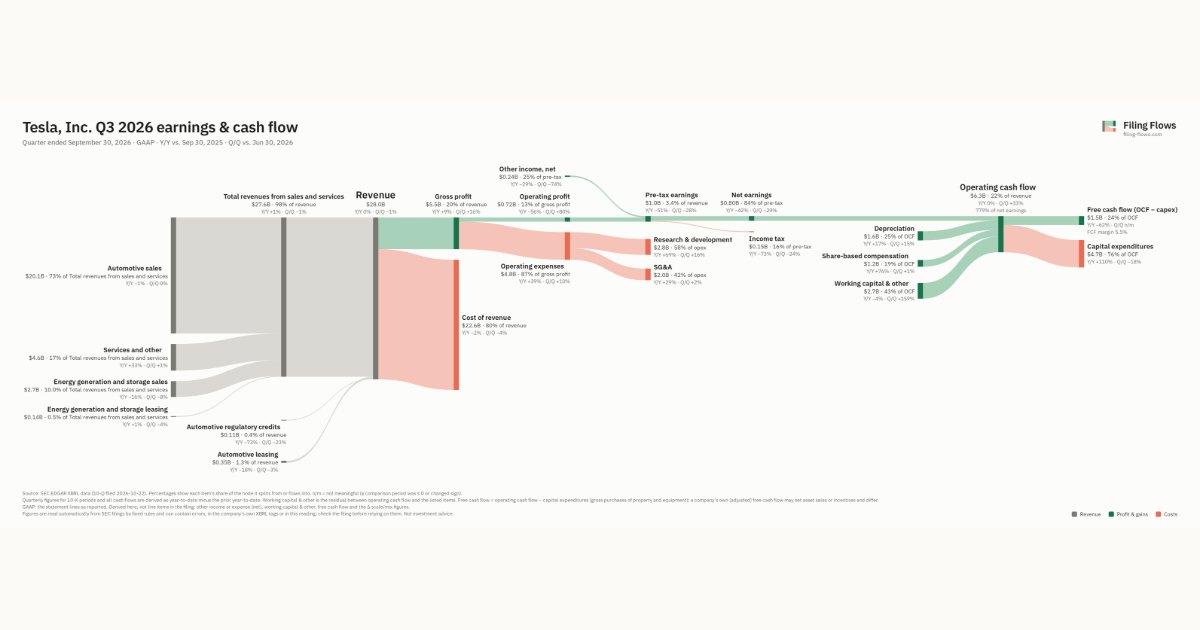
Tesla made $28.0B in Q3 2026 (-0.2% Y/Y): Total revenues from sales and services $27.6B, Automotive leasing $353M, Automotive regulatory credits $113M. Operating margin 2.6%, net earnings $804M. See where every dollar goes — costs, profit and cash — as a Sankey from the 10-Q filed Oct 22, 2026.
Drawing the Sankey…
Open the interactive Sankey → click any line for what the company wrote about it, compare Y/Y and Q/Q, export as PNG or PDF
What changed this quarter
Revenue was $28.0B in Q3 2026, roughly flat year over year and down 1% from the previous quarter. Automotive sales was the largest line at 72% of revenue. Energy generation and storage sales lost $0.54B year over year (down 16%), 1094% of the total change.
Gross margin was 19.6%, up 1.6 points from Q3 2025. Operating profit was $0.72B, a 2.6% margin (down 3.2 points year over year). Operating expenses grew 39% against flat revenue. The fastest-growing cost line was Research & development (+69%). Net earnings were $0.79B, down 43% year over year. The effective tax rate was 15.9%. Non-operating items added $0.24B, 25% of pre-tax earnings, so the bottom line overstates operating performance.
Operating cash flow was $6.3B (roughly flat year over year), 779% of net income including minority interests. Non-cash charges added back $1.6B of depreciation and $1.2B of share-based compensation. Working capital and other items added $2.7B. Capital expenditures of $4.7B left free cash flow of $1.5B.
Quarterly history
| Quarter | Form | Filed | Revenue | Y/Y | Op. margin | Net earnings | Op. cash flow |
|---|---|---|---|---|---|---|---|
| Q3 2026 | 10-Q | Oct 22, 2026 | $28.0B | -0.2% | 2.6% | $804M | $6.3B |
| Q2 2026 | 10-Q | Jul 23, 2026 | $28.2B | +26% | 1.4% | $1.1B | $4.7B |
| Q1 2026 | 10-Q | Apr 23, 2026 | $22.4B | +16% | 4.2% | $491M | $3.9B |
| Q4 2025 | 10-K | Jan 29, 2026 | $24.9B | -3% | 5.7% | $856M | $3.8B |
| Q3 2025 | 10-Q | Oct 23, 2025 | $28.1B | +12% | 5.8% | $1.4B | $6.2B |
| Q2 2025 | 10-Q | Jul 24, 2025 | $22.5B | -12% | 4.1% | $1.2B | $2.5B |
| Q1 2025 | 10-Q | Apr 23, 2025 | $19.3B | -9% | 2.1% | $420M | $2.2B |
Charts
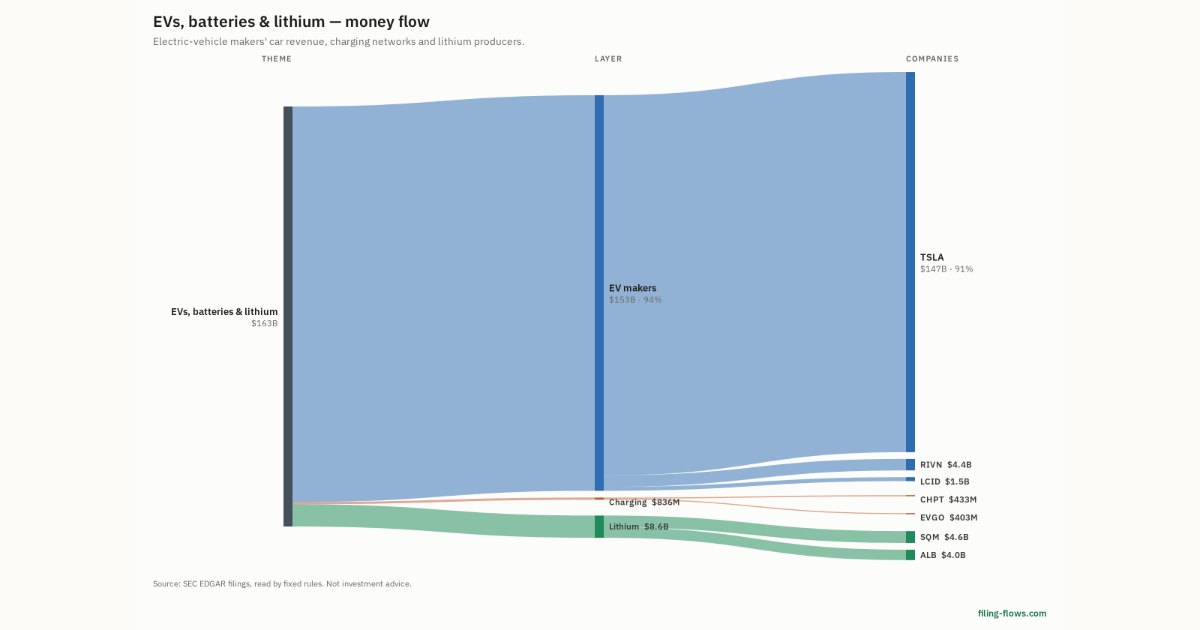
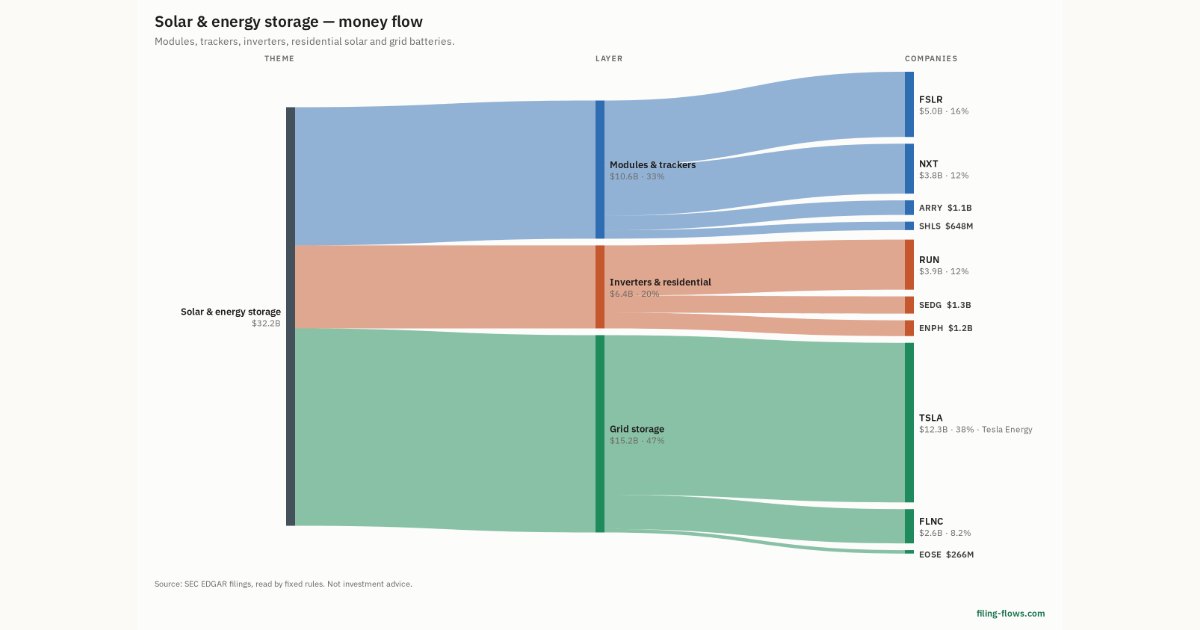
In supply chains and themes
Interactive views
The same charts as the app — open one to draw it.
💵Where each $1 goesinteractive
Loading the interactive chart…
🌏Named in Asian annual reportsinteractive
Loading the interactive chart…
🔄Rotation against the market and its industry (RRG)interactive
Loading the interactive chart…
🔍Earnings qualityinteractive
Loading the interactive chart…
⚖️Fair value by methodinteractive
Loading the interactive chart…
🔭Outlook & guidanceinteractive
Loading the interactive chart…
📈Investments: gains and what it boughtinteractive
Loading the interactive chart…
🏭Its industry’s money flow (input-output)interactive
Loading the interactive chart…
Customers and suppliers named in filings
Sells to
Buys from
About Tesla
We are focused on bringing artificial intelligence (“AI”) into the real world, through products and services like Full Self-Driving (“FSD”) (Supervised) and Robotaxi, as well as working to develop and commercialize AI robots (“Bots”) (including Optimus). We intend to leverage our current operations, in which we design, develop, manufacture, sell and lease high-performance fully electric vehicles and energy generation and storage systems that increasingly deliver AI-related and enhanced software and services to our customers, to achieve that objective. We generally sell our products directly to customers, and continue to grow our global retail, service and charging footprint to accelerate the widespread adoption of our products.
In its own words, from its 10-K, filed Jan 29, 2026.
Tesla against its Motor Vehicles & Passenger Car Bodies peers
The largest companies of the same SEC industry, each at its latest quarter. Revenue growth: -0.2% against the peers' median +6%. Operating margin: 2.6% against the peers' median 2.9%.
| Company | Quarter | Revenue | Y/Y | Op. margin |
|---|---|---|---|---|
| TSLA Tesla | Q3 2026 | $28.0B | -0.2% | 2.6% |
| GM General Motors | Q3 2026 | $50.0B | +3% | 7.2% |
| F Ford Motor | Q3 2026 | $49.5B | -2% | 2.9% |
| PCAR Paccar | Q3 2026 | $7.9B | +19% | 13.6% |
| OSK Oshkosh | Q3 2026 | $2.8B | +6% | 6.9% |
| RIVN Rivian Automotive | Q3 2026 | $2.2B | +38% | -40.9% |
| FSS Federal Signal | Q3 2026 | $656M | +18% | 17.0% |
| LCID Lucid Group | Q2 2026 | $405M | +56% | -267.0% |
| CENN Cenntro | Q2 2026 | $6.2M | -3% | -120.5% |
Source: Tesla 10-Q on SEC EDGAR · CIK 1318605 · Motor Vehicles & Passenger Car Bodies
Guidance and outlook
13F: who owns TSLA and who is buying
More on TSLA
History
Every quarter: Q3 2026 results · Q2 2026 results · Q1 2026 results · Q4 2025 results · Q3 2025 results · Q2 2025 results · Q1 2025 results
- Tesla guidance history: guided vs reported
- Tesla gross margin by quarter
- Tesla operating margin by quarter
- Tesla net income by quarter
- Tesla free cash flow by quarter
- Tesla R&D spending by quarter
- Tesla capital expenditures by quarter
- Tesla Total revenues from sales and services revenue by quarter
- Tesla Automotive leasing revenue by quarter
- Tesla Automotive regulatory credits revenue by quarter