Filing Flows › Consumer Discretionary › Oshkosh (OSK)
Oshkosh (OSK) earnings and revenue breakdown
Latest: Q3 2026 · 10-Q filed Oct 29, 2026 · Oshkosh (OSK) Q3 2026 earnings results →
Q3 2026 Revenue up 6% year over year to $2.8B · 5¢ of every $1 of revenue kept as net profit · operating margin 6.9%
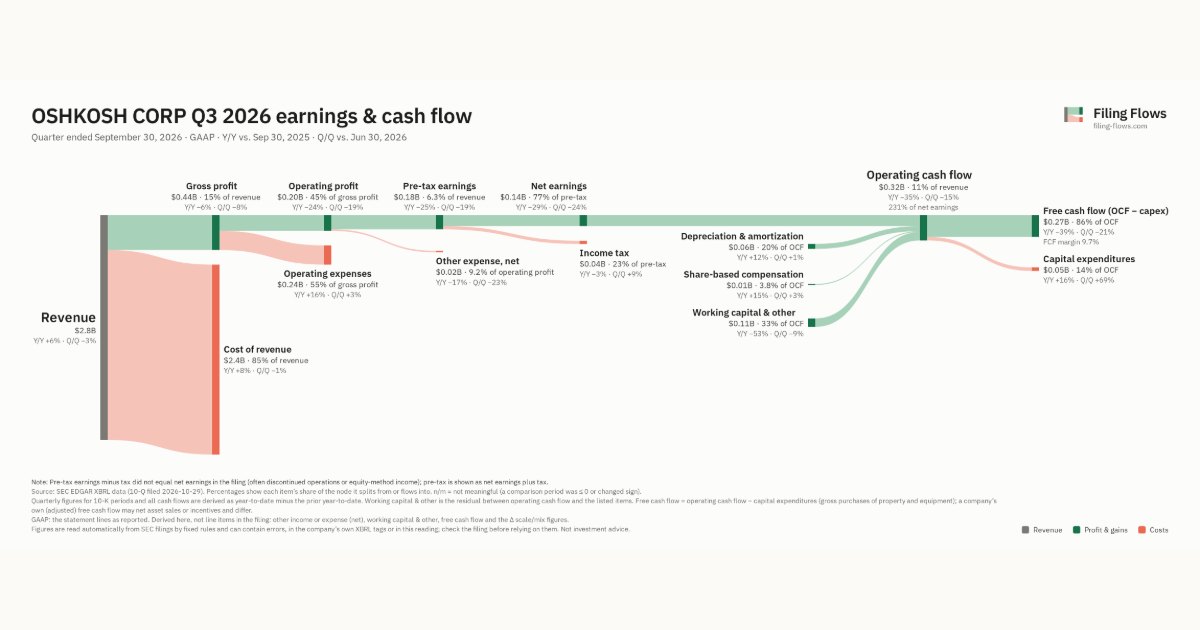
Oshkosh made $2.8B in Q3 2026 (+6% Y/Y). Operating margin 6.9%, net earnings $138M. See where every dollar goes — costs, profit and cash — as a Sankey from the 10-Q filed Oct 29, 2026.
Drawing the Sankey…
Open the interactive Sankey → click any line for what the company wrote about it, compare Y/Y and Q/Q, export as PNG or PDF
What changed this quarter
Revenue was $2.8B in Q3 2026, up 6% year over year and down 3% from the previous quarter.
Gross margin was 15.5%, down 2.0 points from Q3 2025. Operating profit was $0.20B, a 6.9% margin (down 2.7 points year over year). Operating profit fell $0.06B even though revenue rose $0.15B versus Q3 2025, so costs grew faster than sales. Operating expenses grew 16% against revenue growth of 6%. Net earnings were $0.14B, down 29% year over year. The effective tax rate was 22.6%.
Operating cash flow was $0.32B (down 35% year over year), 231% of net earnings. Non-cash charges added back $0.06B of depreciation and amortization and $0.01B of share-based compensation. Working capital and other items added $0.11B. Capital expenditures of $0.05B left free cash flow of $0.27B.
Quarterly history
| Quarter | Form | Filed | Revenue | Y/Y | Op. margin | Net earnings | Op. cash flow |
|---|---|---|---|---|---|---|---|
| Q3 2026 | 10-Q | Oct 29, 2026 | $2.8B | +6% | 6.9% | $138M | $320M |
| Q2 2026 | 10-Q | Jul 28, 2026 | $2.9B | +7% | 8.3% | $183M | $374M |
| Q1 2026 | 10-Q | May 8, 2026 | $2.3B | +0.2% | 3.5% | $43.1M | −$161M |
| Q4 2025 | 10-K | Feb 17, 2026 | $2.7B | +4% | 7.9% | $134M | $600M |
| Q3 2025 | 10-Q | Oct 29, 2025 | $2.7B | -2% | 9.7% | $196M | $489M |
| Q2 2025 | 10-Q | Aug 1, 2025 | $2.7B | -4% | 10.7% | $205M | $89.2M |
| Q1 2025 | 10-Q | Apr 30, 2025 | $2.3B | -9% | 7.6% | $112M | −$395M |
Charts
Interactive views
The same charts as the app — open one to draw it.
💵Where each $1 goesinteractive
Loading the interactive chart…
🌏Named in Asian annual reportsinteractive
Loading the interactive chart…
🔄Rotation against the market and its industry (RRG)interactive
Loading the interactive chart…
🔍Earnings qualityinteractive
Loading the interactive chart…
⚖️Fair value by methodinteractive
Loading the interactive chart…
🔭Outlook & guidanceinteractive
Loading the interactive chart…
📈Investments: gains and what it boughtinteractive
Loading the interactive chart…
🏭Its industry’s money flow (input-output)interactive
Loading the interactive chart…
Customers and suppliers named in filings
Sells to
- U.S. government — 20% of its revenue · Stated in 10-K (sentence) · source
About Oshkosh
Oshkosh Corporation is a global industrial technology company that designs and deploys advanced technologies to empower everyday heroes who build, serve and protect communities around the world. Across construction, firefighting, aviation, refuse collection, defense and delivery industries, we create purpose-built vehicles, equipment and integrated ecosystems that are safe, intuitive and highly productive. As an innovator and integrator, we work directly with our customers to solve real-world challenges – developing and applying breakthrough technologies in autonomy, artificial intelligence, connectivity and electrification. Through these advancements, we make some of the world’s toughest jobs safe, efficient, sustainable and connected — delivering measurable impact for the people who depend on us every day.
In its own words, from its 10-K, filed Feb 17, 2026.
Oshkosh against its Motor Vehicles & Passenger Car Bodies peers
The largest companies of the same SEC industry, each at its latest quarter. Revenue growth: +6% against the peers' median +6%. Operating margin: 6.9% against the peers' median 2.9%.
| Company | Quarter | Revenue | Y/Y | Op. margin |
|---|---|---|---|---|
| OSK Oshkosh | Q3 2026 | $2.8B | +6% | 6.9% |
| GM General Motors | Q3 2026 | $50.0B | +3% | 7.2% |
| F Ford Motor | Q3 2026 | $49.5B | -2% | 2.9% |
| TSLA Tesla | Q3 2026 | $28.0B | -0.2% | 2.6% |
| PCAR Paccar | Q3 2026 | $7.9B | +19% | 13.6% |
| RIVN Rivian Automotive | Q3 2026 | $2.2B | +38% | -40.9% |
| FSS Federal Signal | Q3 2026 | $656M | +18% | 17.0% |
| LCID Lucid Group | Q2 2026 | $405M | +56% | -267.0% |
| CENN Cenntro | Q2 2026 | $6.2M | -3% | -120.5% |
Source: Oshkosh 10-Q on SEC EDGAR · CIK 775158 · Motor Vehicles & Passenger Car Bodies
Guidance and outlook
13F: who owns OSK and who is buying
More on OSK
- How Oshkosh makes money: revenue by segment
- Oshkosh next earnings date and what analysts expect
- Oshkosh stock forecast, price target and fair value
- Who owns Oshkosh stock: holders, funds and Congress trades
- Oshkosh guidance and outlook
- Is Oshkosh a takeover target? LBO and rumors
- Oshkosh recalls, complaints and regulation
History
Every quarter: Q3 2026 results · Q2 2026 results · Q1 2026 results · Q4 2025 results · Q3 2025 results · Q2 2025 results · Q1 2025 results