Filing Flows › Industrials › Legence (LGN)
Legence (LGN) earnings and revenue breakdown
Latest: Q2 2026 · 10-Q filed Aug 13, 2026 · Legence (LGN) Q2 2026 earnings results →
Q2 2026 Revenue up 111% year over year to $1.3B · 3¢ of every $1 of revenue lost · operating margin -0.5%
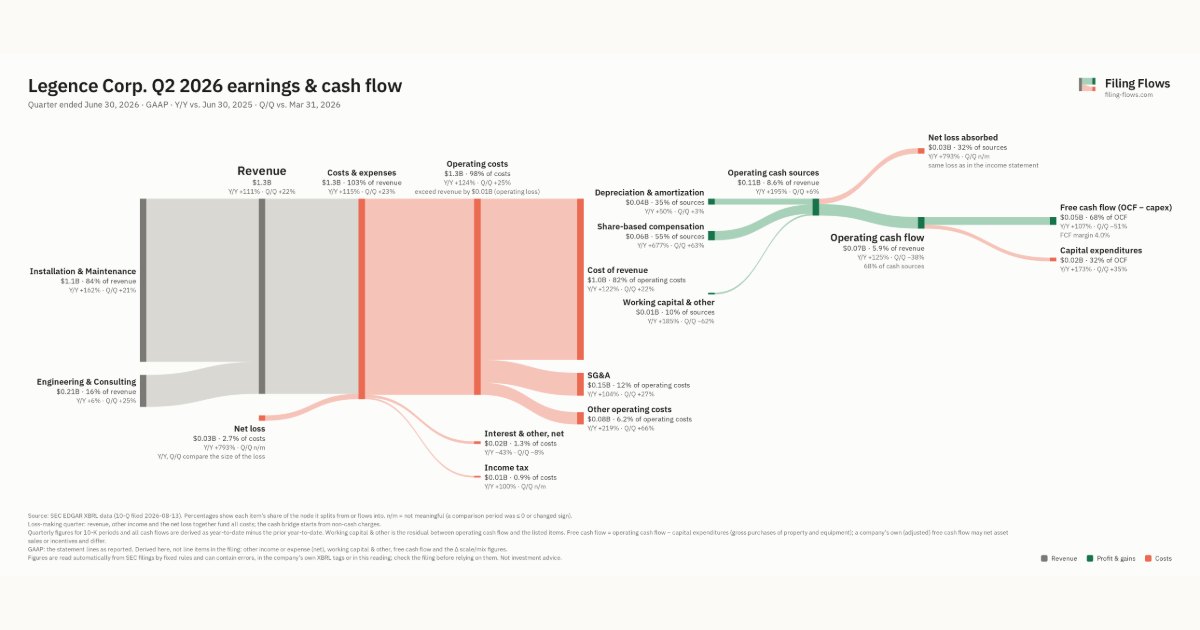
Legence made $1.3B in Q2 2026 (+111% Y/Y): Installation & Maintenance $1.1B, Engineering & Consulting $207M. Operating margin -0.5%, net loss $34.6M. See where every dollar goes — costs, profit and cash — as a Sankey from the 10-Q filed Aug 13, 2026.
Drawing the Sankey…
Open the interactive Sankey → click any line for what the company wrote about it, compare Y/Y and Q/Q, export as PNG or PDF
What changed this quarter
Revenue was $1.3B in Q2 2026, up 111% year over year and up 22% from the previous quarter. Installation & Maintenance was the largest line at 84% of revenue. Installation & Maintenance added $0.65B year over year (up 162%), 98% of the total change.
Gross margin was 17.4%, down 4.0 points from a year earlier. Operating costs exceeded revenue by $0.01B, an operating margin of -0.5%. Operating expenses grew 133% against revenue growth of 111%. The fastest-growing cost line was Other operating costs (+219%). The quarter ended with a net loss of $0.03B, after a profit of $0.02B the previous quarter. Minority interests bore $0.01B of it: to shareholders the quarter was a loss of $0.03B.
Operating cash flow was $0.07B (up 125% year over year). Non-cash charges added back $0.04B of depreciation and amortization and $0.06B of share-based compensation. Working capital and other items added $0.01B. Capital expenditures of $0.02B left free cash flow of $0.05B.
Quarterly history
| Quarter | Form | Filed | Revenue | Y/Y | Op. margin | Net earnings | Op. cash flow |
|---|---|---|---|---|---|---|---|
| Q2 2026 | 10-Q | Aug 13, 2026 | $1.3B | +111% | -0.5% | −$34.6M | $74.4M |
| Q1 2026 | 10-Q | May 14, 2026 | $1.0B | +105% | 2.2% | $16.1M | $120M |
| Q4 2025 | 10-K | Mar 30, 2026 | $738M | +35% | -3.2% | −$54.7M | $94.7M |
| Q3 2025 | 10-Q | Nov 14, 2025 | $708M | +26% | 5.3% | $379K | $99.6M |
Charts
Interactive views
The same charts as the app — open one to draw it.
💵Where each $1 goesinteractive
Loading the interactive chart…
🌏Named in Asian annual reportsinteractive
Loading the interactive chart…
🔄Rotation against the market and its industry (RRG)interactive
Loading the interactive chart…
🔍Earnings qualityinteractive
Loading the interactive chart…
⚖️Fair value by methodinteractive
Loading the interactive chart…
🔭Outlook & guidanceinteractive
Loading the interactive chart…
📈Investments: gains and what it boughtinteractive
Loading the interactive chart…
🏭Its industry’s money flow (input-output)interactive
Loading the interactive chart…
About Legence
We are a leading provider of engineering, installation and maintenance services for mission-critical systems in buildings. We believe that providing integrated solutions for engineering, installing and maintenance of mechanical, electrical and plumbing (“MEP”) systems results in lower total cost, fewer change orders and faster turnaround times for our clients and higher win rates, better customer retention, incremental margin and more recurring revenue for us. We focus on high-growth sectors that have technically demanding buildings, including technology, life sciences, healthcare and education.
In its own words, from its 10-K, filed Mar 30, 2026.
Legence against its Construction - Special Trade Contractors peers
The largest companies of the same SEC industry, each at its latest quarter. Revenue growth: +111% against the peers' median +13%. Operating margin: -0.5% against the peers' median 6.5%.
| Company | Quarter | Revenue | Y/Y | Op. margin |
|---|---|---|---|---|
| LGN Legence | Q2 2026 | $1.3B | +111% | -0.5% |
| RUN Sunrun | Q3 2026 | $1.1B | +52% | 14.0% |
| AMRC Ameresco | Q2 2026 | $515M | +9% | 8.6% |
| AGX Argan | Q2 FY27 | $384M | +62% | 14.8% |
| LMB Limbach Holdings | Q3 2026 | $230M | +25% | 6.5% |
| MTRX Matrix Service | Q1 FY27 | $219M | +4% | 2.0% |
| BBCP Concrete Pumping Holdings | Q3 FY26 | $117M | +13% | 12.9% |
| SPWR SunPower | Q2 2026 | $54.9M | -17% | -42.8% |
| CETX Cemtrex | Q3 FY26 | $18.4M | +9% | -6.5% |
Source: Legence 10-Q on SEC EDGAR · CIK 2052568 · Construction - Special Trade Contractors
Guidance and outlook
13F: who owns LGN and who is buying
More on LGN
History
Every quarter: Q2 2026 results · Q1 2026 results · Q4 2025 results · Q3 2025 results