Filing Flows › Industrials › Sunrun (RUN)
Sunrun (RUN) earnings and revenue breakdown
Latest: Q3 2026 · 10-Q filed Nov 4, 2026 · Sunrun (RUN) Q3 2026 earnings results →
Q3 2026 Revenue up 52% year over year to $1.1B · 14¢ of every $1 of revenue kept as net profit · operating margin 14.0%
Sunrun made $1.1B in Q3 2026 (+52% Y/Y): Customer agreements and incentives $553M, Energy systems and product sales $546M. Operating margin 14.0%, net earnings $153M. See where every dollar goes — costs, profit and cash — as a Sankey from the 10-Q filed Nov 4, 2026.
Drawing the Sankey…
Open the interactive Sankey → click any line for what the company wrote about it, compare Y/Y and Q/Q, export as PNG or PDF
What changed this quarter
Revenue was $1.1B in Q3 2026, up 52% year over year and up 26% from the previous quarter. Customer agreements was the largest line at 47% of revenue. Energy systems added $0.35B year over year (up 212%), 93% of the total change. Products declined 52%.
Operating profit was $0.15B, a 14.0% margin (up 13.5 points year over year). Of the extra revenue versus Q3 2025, 40% reached operating profit, above the 1% margin then. Total costs grew 31% against revenue growth of 52%. The fastest-growing cost line was Sales & marketing (+46%). Net earnings were $0.15B, up 824% year over year ($0.09B including minority interests, which bore $0.07B of losses). The tax line was a benefit of $0.05B on pre-tax earnings of $0.04B.
Operating cash flow was $0.30B, 347% of net income including minority interests. Non-cash charges added back $0.20B of depreciation and amortization and $0.02B of share-based compensation.
Quarterly history
| Quarter | Form | Filed | Revenue | Y/Y | Op. margin | Net earnings | Op. cash flow |
|---|---|---|---|---|---|---|---|
| Q3 2026 | 10-Q | Nov 4, 2026 | $1.1B | +52% | 14.0% | $153M | $301M |
| Q2 2026 | 10-Q | Aug 5, 2026 | $870M | +53% | 4.0% | −$208M | −$186M |
| Q1 2026 | 10-Q | May 6, 2026 | $722M | +43% | -6.0% | −$297M | $10.6M |
| Q4 2025 | 10-K | Feb 26, 2026 | $1.2B | +124% | 8.4% | −$175M | $96.9M |
| Q3 2025 | 10-Q | Nov 6, 2025 | $725M | +35% | 0.5% | −$278M | −$122M |
| Q2 2025 | 10-Q | Aug 6, 2025 | $569M | +9% | -19.7% | −$279M | −$293M |
| Q1 2025 | 10-Q | May 7, 2025 | $504M | +10% | -22.8% | −$277M | −$104M |
Charts
In supply chains and themes
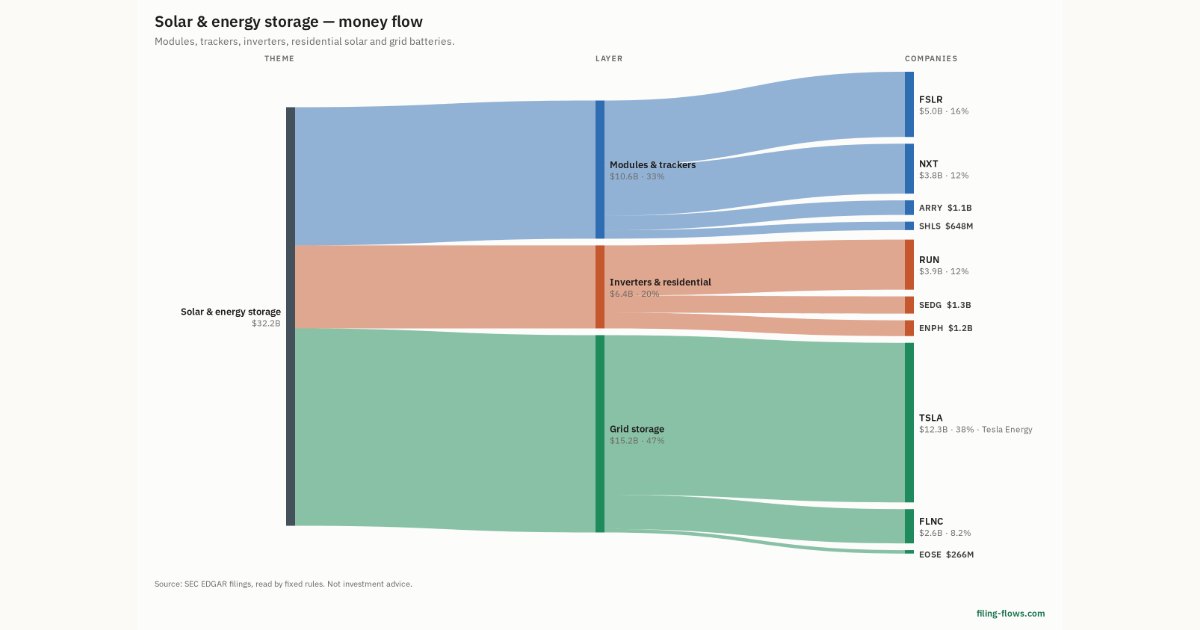
Interactive views
The same charts as the app — open one to draw it.
💵Where each $1 goesinteractive
Loading the interactive chart…
🌏Named in Asian annual reportsinteractive
Loading the interactive chart…
🔄Rotation against the market and its industry (RRG)interactive
Loading the interactive chart…
🔍Earnings qualityinteractive
Loading the interactive chart…
⚖️Fair value by methodinteractive
Loading the interactive chart…
🔭Outlook & guidanceinteractive
Loading the interactive chart…
📈Investments: gains and what it boughtinteractive
Loading the interactive chart…
🏭Its industry’s money flow (input-output)interactive
Loading the interactive chart…
About Sunrun
Sunrun's (the “Company,” “our,” “we”) mission is to connect people to the cleanest energy on earth. Sunrun transformed the solar industry in 2007 by removing financial barriers and democratizing access to locally-generated, renewable energy. Today, Sunrun is the nation’s leading provider of clean energy as a subscription service, offering residential solar and storage with no upfront costs. Sunrun’s innovative products and solutions can connect homes to the cleanest energy on earth, providing them with energy security, predictability, and peace of mind. Sunrun also manages energy services that benefit communities, utilities, and the electric grid while enhancing customer value.
In its own words, from its 10-K, filed Feb 26, 2026.
Sunrun against its Construction - Special Trade Contractors peers
The largest companies of the same SEC industry, each at its latest quarter. Revenue growth: +52% against the peers' median +13%. Operating margin: 14.0% against the peers' median 6.5%.
| Company | Quarter | Revenue | Y/Y | Op. margin |
|---|---|---|---|---|
| RUN Sunrun | Q3 2026 | $1.1B | +52% | 14.0% |
| LGN Legence | Q2 2026 | $1.3B | +111% | -0.5% |
| AMRC Ameresco | Q2 2026 | $515M | +9% | 8.6% |
| AGX Argan | Q2 FY27 | $384M | +62% | 14.8% |
| LMB Limbach Holdings | Q3 2026 | $230M | +25% | 6.5% |
| MTRX Matrix Service | Q1 FY27 | $219M | +4% | 2.0% |
| BBCP Concrete Pumping Holdings | Q3 FY26 | $117M | +13% | 12.9% |
| SPWR SunPower | Q2 2026 | $54.9M | -17% | -42.8% |
| CETX Cemtrex | Q3 FY26 | $18.4M | +9% | -6.5% |
Source: Sunrun 10-Q on SEC EDGAR · CIK 1469367 · Construction - Special Trade Contractors
Guidance and outlook
13F: who owns RUN and who is buying
More on RUN
History
Every quarter: Q3 2026 results · Q2 2026 results · Q1 2026 results · Q4 2025 results · Q3 2025 results · Q2 2025 results · Q1 2025 results