Filing Flows › Materials › Mosaic (MOS)
Mosaic (MOS) earnings and revenue breakdown
Latest: Q3 2026 · 10-Q filed Nov 4, 2026 · Mosaic (MOS) Q3 2026 earnings results →
Q3 2026 Revenue down 10% year over year to $3.1B · 2¢ of every $1 of revenue lost · operating margin -3.1%
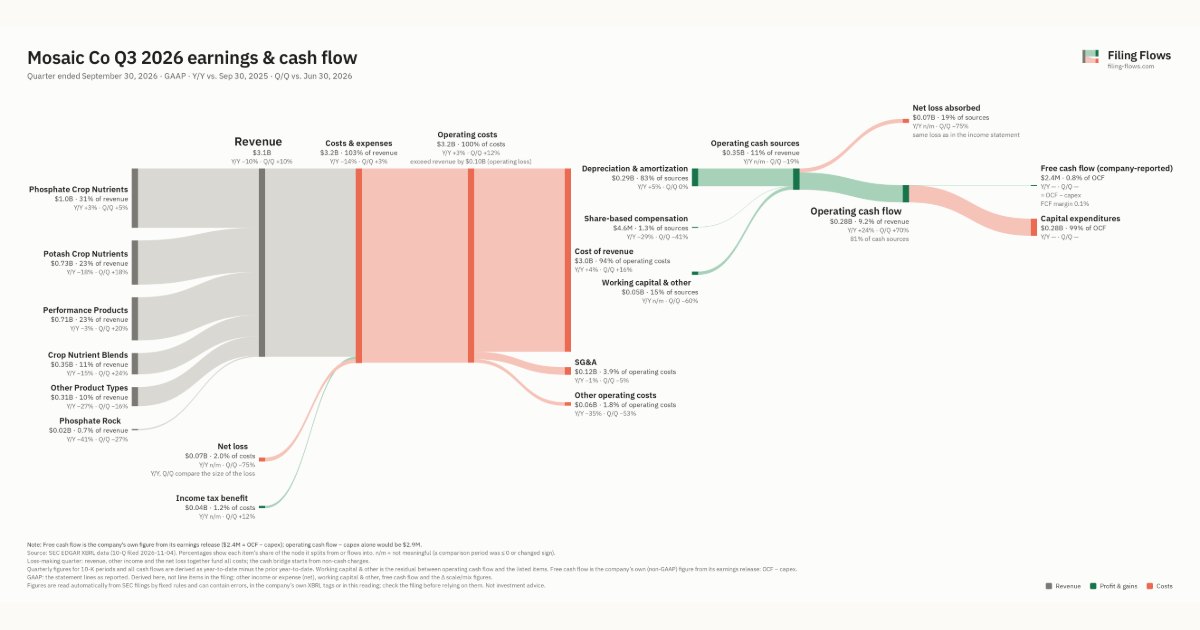
Mosaic made $3.1B in Q3 2026 (-10% Y/Y): Phosphate Crop Nutrients $976M, Potash Crop Nutrients $728M, Performance Products $709M. Operating margin -3.1%, net loss $65.3M. See where every dollar goes — costs, profit and cash — as a Sankey from the 10-Q filed Nov 4, 2026.
Drawing the Sankey…
Open the interactive Sankey → click any line for what the company wrote about it, compare Y/Y and Q/Q, export as PNG or PDF
What changed this quarter
Revenue was $3.1B in Q3 2026, down 10% year over year and up 10% from the previous quarter. Phosphate Crop Nutrients was the largest line at 31% of revenue. Potash Crop Nutrients lost $0.16B year over year (down 18%), 46% of the total change.
Gross margin was 2.7%, down 13.3 points from Q3 2025. Operating costs exceeded revenue by $0.10B, an operating margin of -3.1%. Operating expenses fell 15% while revenue fell 10%. The quarter ended with a net loss of $0.07B, narrower than the previous quarter's $0.27B loss.
Operating cash flow was $0.28B (up 24% year over year). Non-cash charges added back $0.29B of depreciation and amortization and $4.6M of share-based compensation. Working capital and other items added $0.05B. After capital expenditures ($0.28B), free cash flow as the company reports it was $2.4M.
Quarterly history
| Quarter | Form | Filed | Revenue | Y/Y | Op. margin | Net earnings | Op. cash flow |
|---|---|---|---|---|---|---|---|
| Q3 2026 | 10-Q | Nov 4, 2026 | $3.1B | -10% | -3.1% | −$65.3M | $284M |
| Q2 2026 | 10-Q | Aug 5, 2026 | $2.8B | -6% | -1.3% | −$266M | $167M |
| Q1 2026 | 10-Q | May 11, 2026 | $3.0B | +14% | -12.4% | −$254M | $104M |
| Q4 2025 | 10-K | Feb 27, 2026 | $3.0B | +6% | -3.4% | −$518M | −$56.1M |
| Q3 2025 | 10-Q | Nov 5, 2025 | $3.5B | +23% | 9.8% | $411M | $228M |
| Q2 2025 | 10-Q | Aug 6, 2025 | $3.0B | +7% | 8.1% | $411M | $610M |
| Q1 2025 | 10-Q | May 7, 2025 | $2.6B | -2% | 12.9% | $238M | $42.9M |
Charts
Interactive views
The same charts as the app — open one to draw it.
💵Where each $1 goesinteractive
Loading the interactive chart…
🌏Named in Asian annual reportsinteractive
Loading the interactive chart…
🔄Rotation against the market and its industry (RRG)interactive
Loading the interactive chart…
🔍Earnings qualityinteractive
Loading the interactive chart…
⚖️Fair value by methodinteractive
Loading the interactive chart…
🔭Outlook & guidanceinteractive
Loading the interactive chart…
📈Investments: gains and what it boughtinteractive
Loading the interactive chart…
🏭Its industry’s money flow (input-output)interactive
Loading the interactive chart…
Customers and suppliers named in filings
Buys from
About Mosaic
The Mosaic Company is the world’s leading producer and marketer of concentrated phosphate and potash crop nutrients. Through our broad product offering, we are a single source supplier of phosphate- and potash-based crop nutrients and animal feed ingredients. We serve customers in approximately 40 countries. We are the second largest integrated phosphate producer in the world and one of the largest producers and marketers of phosphate-based animal feed ingredients in North America and Brazil. We are the leading fertilizer production and distribution company in Brazil. We mine phosphate rock in Florida, Brazil and Peru. We process rock into finished phosphate products at facilities in Florida, Louisiana and Brazil. We are typically one of the top four global potash producers in the world. We mine potash in Saskatchewan and New Mexico.
In its own words, from its 10-K, filed Feb 27, 2026.
Mosaic against its Agricultural Chemicals peers
The largest companies of the same SEC industry, each at its latest quarter. Revenue growth: -10% against the peers' median +1%. Operating margin: -3.1% against the peers' median -2.5%.
| Company | Quarter | Revenue | Y/Y | Op. margin |
|---|---|---|---|---|
| MOS Mosaic | Q3 2026 | $3.1B | -10% | -3.1% |
| CF CF Industries Holdings | Q3 2026 | $1.9B | +12% | 37.7% |
| SMG Scotts Miracle-Gro | Q3 FY26 | $1.2B | +1% | 14.5% |
| UAN CVR Partners, LP | Q3 2026 | $146M | -11% | -2.5% |
| AVD American Vanguard | Q2 2026 | $117M | -10% | -0.3% |
| CBUS Cibus | Q2 2026 | $994K | +6% | n/m |
| SNES SenesTech | Q2 2026 | $770K | +23% | -241.8% |
Source: Mosaic 10-Q on SEC EDGAR · CIK 1285785 · Agricultural Chemicals
Guidance and outlook
13F: who owns MOS and who is buying
More on MOS
- How Mosaic makes money: revenue by segment
- Mosaic next earnings date and what analysts expect
- Mosaic stock forecast, price target and fair value
- Who owns Mosaic stock: holders, funds and Congress trades
- Mosaic guidance and outlook
- Is Mosaic a takeover target? LBO and rumors
- Mosaic recalls, complaints and regulation
History
Every quarter: Q3 2026 results · Q2 2026 results · Q1 2026 results · Q4 2025 results · Q3 2025 results · Q2 2025 results · Q1 2025 results
- Mosaic guidance history: guided vs reported
- Mosaic gross margin by quarter
- Mosaic operating margin by quarter
- Mosaic net income by quarter
- Mosaic capital expenditures by quarter
- Mosaic Phosphate Crop Nutrients revenue by quarter
- Mosaic Potash Crop Nutrients revenue by quarter
- Mosaic Performance Products revenue by quarter