Filing Flows › Financials › Old Republic International (ORI)
Old Republic International (ORI) earnings and revenue breakdown
Latest: Q3 2026 · 10-Q filed Oct 30, 2026 · Old Republic International (ORI) Q3 2026 earnings results →
Q3 2026 Revenue up 5% year over year to $2.6B · 10¢ of every $1 of revenue kept as net profit · operating margin 10.7%
Old Republic International made $2.6B in Q3 2026 (+5% Y/Y). Operating margin 10.7%, net earnings $244M. See where every dollar goes — costs, profit and cash — as a Sankey from the 10-Q filed Oct 30, 2026.
Drawing the Sankey…
Open the interactive Sankey → click any line for what the company wrote about it, compare Y/Y and Q/Q, export as PNG or PDF
What changed this quarter
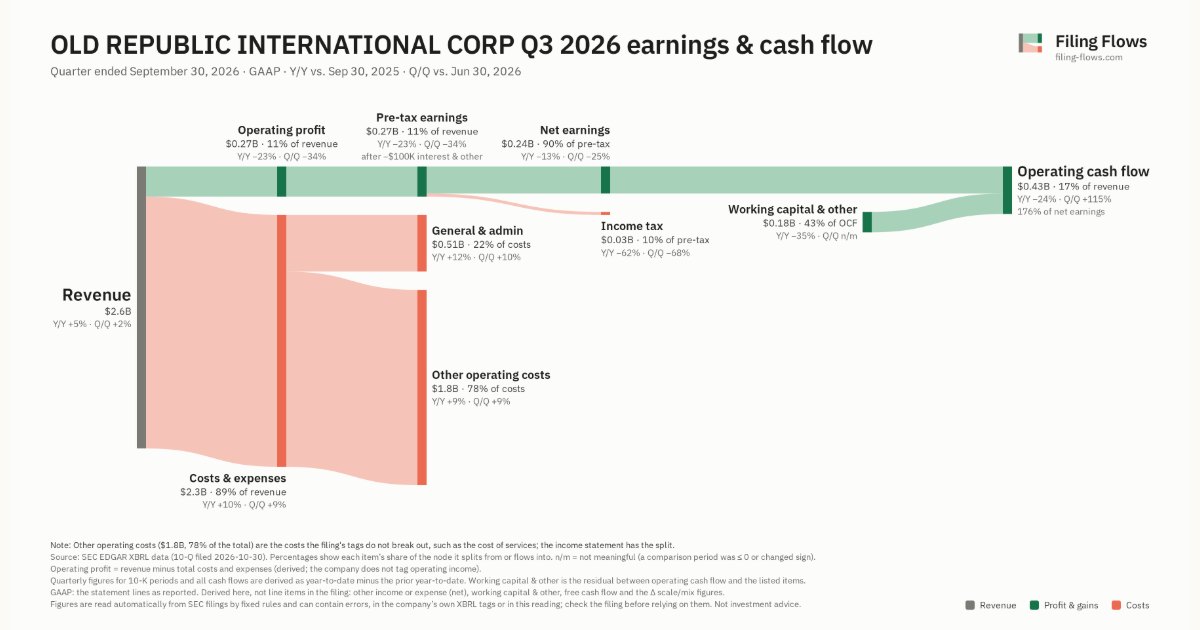
Revenue was $2.6B in Q3 2026, up 5% year over year and up 2% from the previous quarter.
Operating profit was $0.27B, a 10.7% margin (down 3.9 points year over year). Operating profit fell $0.08B even though revenue rose $0.13B versus Q3 2025, so costs grew faster than sales. Total costs grew 10% against revenue growth of 5%. The fastest-growing cost line was General & admin (+12%). Net earnings were $0.24B, down 13% year over year. The effective tax rate was 10.2%.
Operating cash flow was $0.43B (down 24% year over year), 176% of net earnings. Working capital and other items added $0.18B.
Quarterly history
| Quarter | Form | Filed | Revenue | Y/Y | Op. margin | Net earnings | Op. cash flow |
|---|---|---|---|---|---|---|---|
| Q3 2026 | 10-Q | Oct 30, 2026 | $2.6B | +5% | 10.7% | $244M | $429M |
| Q2 2026 | 10-Q | Jul 31, 2026 | $2.5B | +13% | 16.4% | $322M | $200M |
| Q1 2026 | 10-Q | May 1, 2026 | $2.4B | +14% | 17.2% | $330M | $281M |
| Q4 2025 | 10-K | Feb 26, 2026 | $2.4B | +19% | 11.0% | $207M | $235M |
| Q3 2025 | 10-Q | Oct 31, 2025 | $2.4B | +4% | 14.6% | $280M | $564M |
| Q2 2025 | 10-Q | Aug 1, 2025 | $2.2B | +18% | 11.8% | $204M | $134M |
| Q1 2025 | 10-Q | May 2, 2025 | $2.1B | +5% | 14.6% | $246M | $232M |
Charts
Interactive views
The same charts as the app — open one to draw it.
💵Where each $1 goesinteractive
Loading the interactive chart…
🌏Named in Asian annual reportsinteractive
Loading the interactive chart…
🔄Rotation against the market and its industry (RRG)interactive
Loading the interactive chart…
🔍Earnings qualityinteractive
Loading the interactive chart…
⚖️Fair value by methodinteractive
Loading the interactive chart…
🔭Outlook & guidanceinteractive
Loading the interactive chart…
📈Investments: gains and what it boughtinteractive
Loading the interactive chart…
🏭Its industry’s money flow (input-output)interactive
Loading the interactive chart…
About Old Republic International
(a) General Description of Business. Old Republic International Corporation is a Chicago-based holding company engaged in the business of insurance underwriting and related services. It conducts its business through a number of operating companies, which utilize one or more insurance company subsidiaries to issue their policies, and is organized into two segments: Specialty Insurance and Title Insurance. References herein to such segments apply to the Company's subsidiaries engaged in these respective segments of business. The results of the Republic Financial Indemnity Group (RFIG) Run-off business, previously a reportable segment, are deemed immaterial and reflected within the Corporate & Other caption of this report through the effective date of its sale of May 31, 2024, along with the results of a small life and accident insurance business.
In its own words, from its 10-K, filed Feb 26, 2026.
Old Republic International against its Surety Insurance peers
The largest companies of the same SEC industry, each at its latest quarter. Revenue growth: +5% against the peers' median +20%. Operating margin: 10.7% against the peers' median 40.7%.
| Company | Quarter | Revenue | Y/Y | Op. margin |
|---|---|---|---|---|
| ORI Old Republic International | Q3 2026 | $2.6B | +5% | 10.7% |
| RDN Radian Group | Q3 2026 | $624M | +106% | 36.6% |
| ESNT Essent Group | Q3 2026 | $374M | +20% | 53.2% |
| MTG Mgic Investment | Q3 2026 | $299M | -2% | 74.0% |
| AGO Assured Guaranty | Q3 2026 | $214M | +3% | 40.7% |
| NMIH NMI Holdings | Q3 2026 | $188M | +5% | 64.1% |
| OSG Octave Specialty Group | Q2 2026 | $83.0M | +51% | -14.1% |
| MBI Mbia | Q3 2026 | $26.0M | +73% | -88.5% |
Source: Old Republic International 10-Q on SEC EDGAR · CIK 74260 · Surety Insurance
13F: who owns ORI and who is buying
More on ORI
History
Every quarter: Q3 2026 results · Q2 2026 results · Q1 2026 results · Q4 2025 results · Q3 2025 results · Q2 2025 results · Q1 2025 results