Filing Flows › Materials › PAN American Silver (PAAS)
PAN American Silver (PAAS) earnings and revenue breakdown
Latest: FY2025 · 40-F filed Feb 18, 2026 · PAN American Silver (PAAS) FY2025 earnings results →
FY2025 Revenue up 28% year over year to $3.6B · 27¢ of every $1 of revenue kept as net profit · operating margin 34.1%
PAN American Silver made $3.6B in FY2025 (+28% Y/Y). Operating margin 34.1%, net earnings $980M. See where every dollar goes — costs, profit and cash — as a Sankey from the 40-F filed Feb 18, 2026.
Drawing the Sankey…
Open the interactive Sankey → click any line for what the company wrote about it, compare Y/Y and Q/Q, export as PNG or PDF
What changed this quarter
Revenue was $3.6B in FY2025, up 28% year over year.
Gross margin was 38.8%, up 19.3 points from FY2024. Operating profit was $1.2B, a 34.1% margin (up 15.2 points year over year). Of the extra revenue versus FY2024, 88% reached operating profit, above the 19% margin then. Operating expenses grew 856% against revenue growth of 28%. Net earnings were $1.0B, up 773% year over year. The effective tax rate was 20.8%.
Operating cash flow was $1.3B (up 84% year over year), 136% of net earnings. Non-cash charges added back $0.50B of depreciation and amortization and $2.0M of share-based compensation. Working capital and other items used $0.15B. Capital expenditures of $0.31B left free cash flow of $1.0B.
Quarterly history
| Quarter | Form | Filed | Revenue | Y/Y | Op. margin | Net earnings | Op. cash flow |
|---|---|---|---|---|---|---|---|
| FY2025 | 40-F | Feb 18, 2026 | $3.6B | +28% | 34.1% | $980M | $1.3B |
| FY2024 | 40-F | Feb 19, 2025 | $2.8B | +22% | 18.8% | $113M | $724M |
Charts
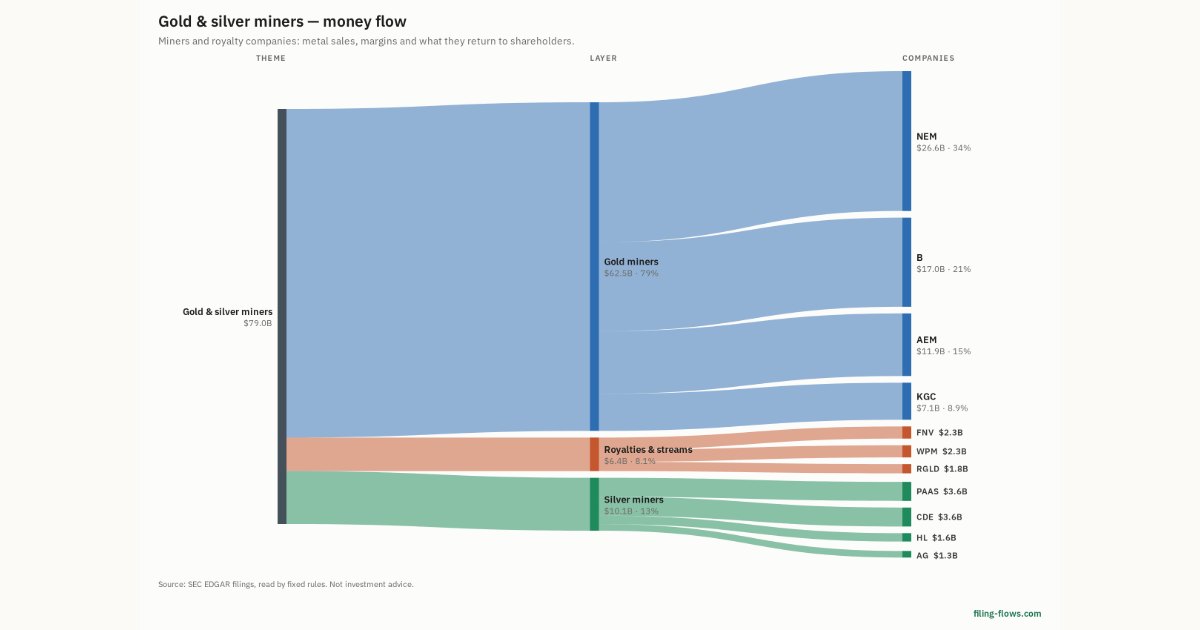
In supply chains and themes
Interactive views
The same charts as the app — open one to draw it.
💵Where each $1 goesinteractive
Loading the interactive chart…
🌏Named in Asian annual reportsinteractive
Loading the interactive chart…
🔄Rotation against the market and its industry (RRG)interactive
Loading the interactive chart…
🔍Earnings qualityinteractive
Loading the interactive chart…
⚖️Fair value by methodinteractive
Loading the interactive chart…
🔭Outlook & guidanceinteractive
Loading the interactive chart…
📈Investments: gains and what it boughtinteractive
Loading the interactive chart…
🏭Its industry’s money flow (input-output)interactive
Loading the interactive chart…
About PAN American Silver
Pan American is a leading producer of silver and gold in the Americas, operating mines in Canada, Mexico, Peru, Brazil, Bolivia, Chile and Argentina. We also own a 44% joint venture interest in the Juanicipio mine in Mexico, a 100% interest in the Escobal mine in Guatemala that is currently not operating, and we hold interests in exploration and development projects. We have been operating in the Americas for over three decades, earning an industry-leading reputation for sustainability performance, operational excellence and prudent financial management. We are headquartered in Vancouver, B.C. and our shares trade on the New York Stock Exchange and the Toronto Stock Exchange under the symbol "PAAS".
In its own words, from its 6-K, filed Feb 18, 2026.
PAN American Silver against its Gold and Silver Ores peers
The largest companies of the same SEC industry, each at its latest quarter. Revenue growth: +28% against the peers' median +28%. Operating margin: 34.1% against the peers' median 38.6%.
| Company | Quarter | Revenue | Y/Y | Op. margin |
|---|---|---|---|---|
| PAAS PAN American Silver | FY2025 | $3.6B | +28% | 34.1% |
| KGC Kinross Gold | FY2025 | $7.1B | +37% | 46.5% |
| NEM Newmont | Q3 2026 | $6.4B | +15% | 49.7% |
| B Barrick Mining | Q2 2025 | $3.7B | +16% | 38.5% |
| CDE Coeur Mining | Q3 2026 | $984M | +77% | 17.7% |
| WPM Wheaton Precious Metals | Q3 2026 | $772M | — | 66.2% |
| AG First Majestic Silver | Q3 2026 | $394M | — | 38.6% |
| FNV Franco Nevada | Q2 2025 | $369M | +42% | 82.8% |
| MUX McEwen | Q2 2026 | $59.2M | +27% | 13.0% |
Source: PAN American Silver 40-F on SEC EDGAR · CIK 771992 · Gold and Silver Ores
13F: who owns PAAS and who is buying
More on PAAS
History
Every quarter: FY2025 results · FY2024 results