Filing Flows › Industrials › Pultegroup (PHM)
Pultegroup (PHM) earnings and revenue breakdown
Latest: Q3 2026 · 10-Q filed Oct 22, 2026 · Pultegroup (PHM) Q3 2026 earnings results →
Q3 2026 Revenue down 10% year over year to $4.0B · 12¢ of every $1 of revenue kept as net profit · operating margin 15.7%
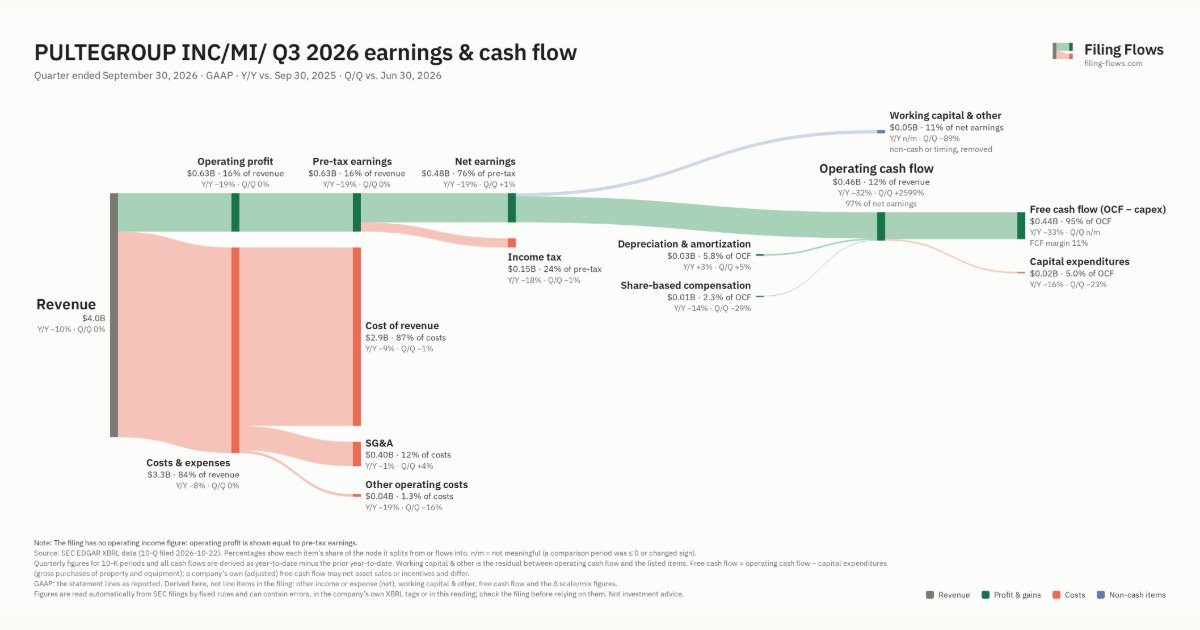
Pultegroup made $4.0B in Q3 2026 (-10% Y/Y). Operating margin 15.7%, net earnings $476M. See where every dollar goes — costs, profit and cash — as a Sankey from the 10-Q filed Oct 22, 2026.
Drawing the Sankey…
Open the interactive Sankey → click any line for what the company wrote about it, compare Y/Y and Q/Q, export as PNG or PDF
What changed this quarter
Revenue was $4.0B in Q3 2026, down 10% year over year and roughly flat from the previous quarter.
Operating profit was $0.63B, a 15.7% margin (down 1.7 points year over year). Total costs fell 8% while revenue fell 10%. Net earnings were $0.48B, down 19% year over year. The effective tax rate was 23.9%.
Operating cash flow was $0.46B (down 32% year over year), 97% of net earnings. Non-cash charges added back $0.03B of depreciation and amortization and $0.01B of share-based compensation. Working capital and other items used $0.05B. Capital expenditures of $0.02B left free cash flow of $0.44B.
Quarterly history
| Quarter | Form | Filed | Revenue | Y/Y | Op. margin | Net earnings | Op. cash flow |
|---|---|---|---|---|---|---|---|
| Q3 2026 | 10-Q | Oct 22, 2026 | $4.0B | -10% | 15.7% | $476M | $460M |
| Q2 2026 | 10-Q | Jul 22, 2026 | $4.0B | -10% | 15.6% | $472M | $17.1M |
| Q1 2026 | 10-Q | Apr 23, 2026 | $3.4B | -12% | 13.2% | $347M | $160M |
| Q4 2025 | 10-K | Feb 4, 2026 | $4.6B | -6% | 14.2% | $502M | $771M |
| Q3 2025 | 10-Q | Oct 21, 2025 | $4.4B | -2% | 17.4% | $586M | $678M |
| Q2 2025 | 10-Q | Jul 22, 2025 | $4.4B | -4% | 18.3% | $608M | $288M |
| Q1 2025 | 10-Q | Apr 22, 2025 | $3.9B | -1% | 17.5% | $523M | $134M |
Charts
Interactive views
The same charts as the app — open one to draw it.
💵Where each $1 goesinteractive
Loading the interactive chart…
🌏Named in Asian annual reportsinteractive
Loading the interactive chart…
🔄Rotation against the market and its industry (RRG)interactive
Loading the interactive chart…
🔍Earnings qualityinteractive
Loading the interactive chart…
⚖️Fair value by methodinteractive
Loading the interactive chart…
🔭Outlook & guidanceinteractive
Loading the interactive chart…
📈Investments: gains and what it boughtinteractive
Loading the interactive chart…
🏭Its industry’s money flow (input-output)interactive
Loading the interactive chart…
About Pultegroup
PulteGroup, Inc. (NYSE: PHM), based in Atlanta, Georgia, is one of America’s largest homebuilding companies with operations in more than 45 markets throughout the country. Through its brand portfolio that includes Centex, Pulte Homes, Del Webb, DiVosta Homes, and John Wieland Homes and Neighborhoods, the company is one of the industry’s most versatile homebuilders able to meet the needs of multiple buyer groups and respond to changing consumer demand. PulteGroup’s purpose is building incredible places where people can live their dreams.
In its own words, from its 8-K, filed Jul 22, 2026.
Pultegroup against its Operative Builders peers
The largest companies of the same SEC industry, each at its latest quarter. Revenue growth: -10% against the peers' median -8%. Operating margin: 15.7% against the peers' median 8.8%.
| Company | Quarter | Revenue | Y/Y | Op. margin |
|---|---|---|---|---|
| PHM Pultegroup | Q3 2026 | $4.0B | -10% | 15.7% |
| DHI Horton D R | Q4 FY26 | $9.4B | -3% | 10.8% |
| TOL Toll Brothers | Q3 FY26 | $2.7B | -10% | 13.5% |
| NVR NVR | Q3 2026 | $2.4B | -8% | 13.9% |
| ECG Everus Construction Group | Q3 2026 | $1.4B | +40% | 8.8% |
| KBH KB Home | Q3 FY26 | $1.3B | -20% | 6.3% |
| MHO M/I Homes | Q3 2026 | $1.1B | -5% | 7.7% |
| DFH Dream Finders Homes | Q3 2026 | $996M | +3% | 1.3% |
| CCS Century Communities | Q3 2026 | $864M | -12% | 1.8% |
Source: Pultegroup 10-Q on SEC EDGAR · CIK 822416 · Operative Builders
13F: who owns PHM and who is buying
More on PHM
History
Every quarter: Q3 2026 results · Q2 2026 results · Q1 2026 results · Q4 2025 results · Q3 2025 results · Q2 2025 results · Q1 2025 results