Filing Flows › Industrials › Toll Brothers (TOL)
Toll Brothers (TOL) earnings and revenue breakdown
Latest: Q3 FY26 · 10-Q filed Aug 28, 2026 · Toll Brothers (TOL) Q3 FY26 earnings results →
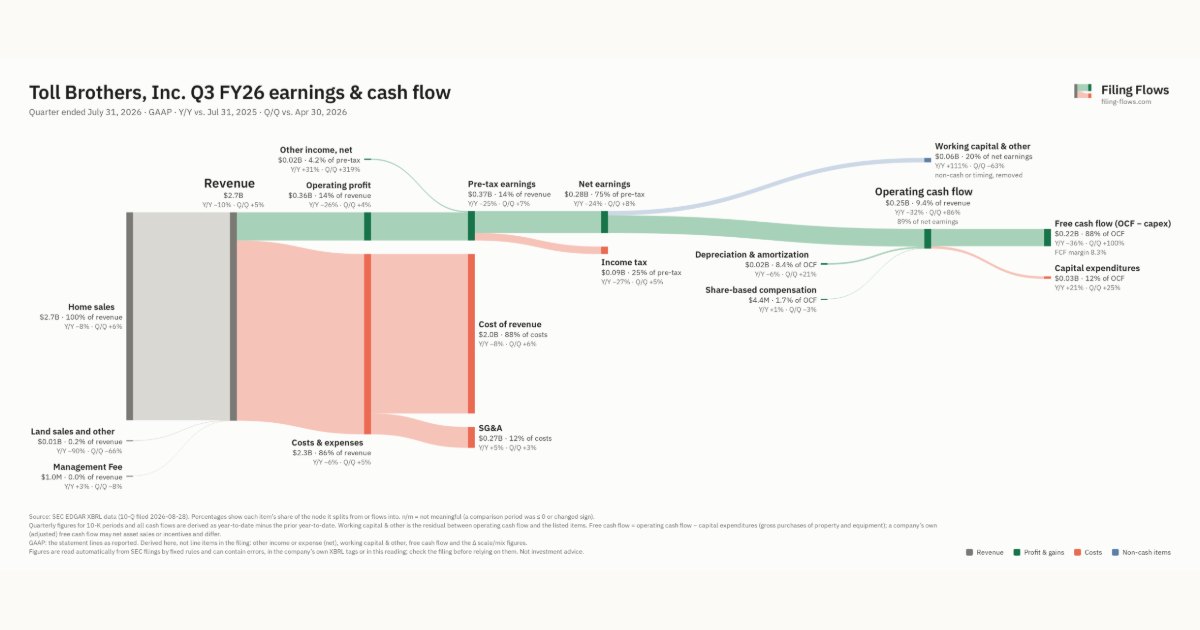
Q3 FY26 Revenue down 10% year over year to $2.7B · 11¢ of every $1 of revenue kept as net profit · operating margin 13.5%
Toll Brothers made $2.7B in Q3 FY26 (-10% Y/Y): Home sales $2.7B, Land sales and other $6.3M, Management Fee $953K. Operating margin 13.5%, net earnings $280M. See where every dollar goes — costs, profit and cash — as a Sankey from the 10-Q filed Aug 28, 2026.
Drawing the Sankey…
Open the interactive Sankey → click any line for what the company wrote about it, compare Y/Y and Q/Q, export as PNG or PDF
What changed this quarter
Revenue was $2.7B in Q3 FY26, down 10% year over year and up 5% from the previous quarter. Home sales was the largest line at 100% of revenue. Home sales lost $0.23B year over year (down 8%), 80% of the total change.
Operating profit was $0.36B, a 13.5% margin (down 3.1 points year over year). Total costs fell 6% while revenue fell 10%. Net earnings were $0.28B, down 24% year over year. The effective tax rate was 25.2%.
Operating cash flow was $0.25B (down 32% year over year), 89% of net earnings. Non-cash charges added back $0.02B of depreciation and amortization and $4.4M of share-based compensation. Working capital and other items used $0.06B. Capital expenditures of $0.03B left free cash flow of $0.22B.
Quarterly history
| Quarter | Form | Filed | Revenue | Y/Y | Op. margin | Net earnings | Op. cash flow |
|---|---|---|---|---|---|---|---|
| Q3 FY26 | 10-Q | Aug 28, 2026 | $2.7B | -10% | 13.5% | $280M | $250M |
| Q2 FY26 | 10-Q | May 29, 2026 | $2.5B | -8% | 13.7% | $261M | $134M |
| Q1 FY26 | 10-Q | Feb 27, 2026 | $2.1B | +15% | 10.2% | $211M | $7.3M |
| Q4 FY25 | 10-K | Dec 19, 2025 | $3.4B | +3% | 16.5% | $448M | $800M |
| Q3 FY25 | 10-Q | Aug 28, 2025 | $2.9B | +8% | 16.6% | $369M | $370M |
| Q2 FY25 | 10-Q | May 29, 2025 | $2.7B | -4% | 16.4% | $352M | $363M |
| Q4 FY24 | 10-K | Dec 20, 2024 | $3.3B | +10% | 18.3% | $475M | $683M |
Charts
Interactive views
The same charts as the app — open one to draw it.
💵Where each $1 goesinteractive
Loading the interactive chart…
🌏Named in Asian annual reportsinteractive
Loading the interactive chart…
🔄Rotation against the market and its industry (RRG)interactive
Loading the interactive chart…
🔍Earnings qualityinteractive
Loading the interactive chart…
⚖️Fair value by methodinteractive
Loading the interactive chart…
🔭Outlook & guidanceinteractive
Loading the interactive chart…
📈Investments: gains and what it boughtinteractive
Loading the interactive chart…
🏭Its industry’s money flow (input-output)interactive
Loading the interactive chart…
About Toll Brothers
Toll Brothers, Inc., a corporation incorporated in Delaware in May 1986, began doing business through predecessor entities in 1967. When this report uses the words “we,” “us,” “our,” and the “Company,” it refers to Toll Brothers, Inc. and its subsidiaries, unless the context otherwise requires. References herein to fiscal year refer to our fiscal years ended or ending October 31. We design, build, market, sell, and arrange financing for an array of luxury residential single-family detached home, attached home, master-planned, and urban low-, mid-, and high-rise communities. In recent years, we have pursued a strategy of broadening our product lines, price points and geographic footprint, as well as increasing the number of quick move-in (or “spec”) homes that we sell relative to our traditional build-to-order homes.
In its own words, from its 10-K, filed Dec 19, 2025.
Toll Brothers against its Operative Builders peers
The largest companies of the same SEC industry, each at its latest quarter. Revenue growth: -10% against the peers' median -8%. Operating margin: 13.5% against the peers' median 8.8%.
| Company | Quarter | Revenue | Y/Y | Op. margin |
|---|---|---|---|---|
| TOL Toll Brothers | Q3 FY26 | $2.7B | -10% | 13.5% |
| DHI Horton D R | Q4 FY26 | $9.4B | -3% | 10.8% |
| PHM Pultegroup | Q3 2026 | $4.0B | -10% | 15.7% |
| NVR NVR | Q3 2026 | $2.4B | -8% | 13.9% |
| ECG Everus Construction Group | Q3 2026 | $1.4B | +40% | 8.8% |
| KBH KB Home | Q3 FY26 | $1.3B | -20% | 6.3% |
| MHO M/I Homes | Q3 2026 | $1.1B | -5% | 7.7% |
| DFH Dream Finders Homes | Q3 2026 | $996M | +3% | 1.3% |
| CCS Century Communities | Q3 2026 | $864M | -12% | 1.8% |
Source: Toll Brothers 10-Q on SEC EDGAR · CIK 794170 · Operative Builders
Guidance and outlook
13F: who owns TOL and who is buying
More on TOL
History
Every quarter: Q3 FY26 results · Q2 FY26 results · Q1 FY26 results · Q4 FY25 results · Q3 FY25 results · Q2 FY25 results · Q4 FY24 results
- Toll Brothers guidance history: guided vs reported
- Toll Brothers operating margin by quarter
- Toll Brothers net income by quarter
- Toll Brothers free cash flow by quarter
- Toll Brothers capital expenditures by quarter
- Toll Brothers Home sales revenue by quarter
- Toll Brothers Land sales and other revenue by quarter
- Toll Brothers Management Fee revenue by quarter