Filing Flows › Technology › Quantum Computing (QUBT)
Quantum Computing (QUBT) earnings and revenue breakdown
Latest: Q2 2026 · 10-Q filed Aug 10, 2026 · Quantum Computing (QUBT) Q2 2026 earnings results →
Q2 2026 Revenue up 9000% year over year to $5.6M · 212¢ of every $1 of revenue lost · operating margin -414.6%
Quantum Computing made $5.6M in Q2 2026 (91× Y/Y). Operating margin -414.6%, net loss $11.8M. See where every dollar goes — costs, profit and cash — as a Sankey from the 10-Q filed Aug 10, 2026.
Drawing the Sankey…
Open the interactive Sankey → click any line for what the company wrote about it, compare Y/Y and Q/Q, export as PNG or PDF
What changed this quarter
Revenue was $5.6M in Q2 2026, up 9000% year over year and up 50% from the previous quarter.
Operating costs exceeded revenue by $23.0M, an operating margin of -414.6%. The fastest-growing cost line was General & admin (+224%). The quarter ended with a net loss of $11.8M, wider than the previous quarter's $4.0M loss. Non-operating items added $11.3M, -96% of pre-tax earnings, so the bottom line overstates operating performance.
Operating cash flow was −$13.9M. Non-cash charges added back $3.2M of depreciation and amortization and $1.8M of share-based compensation. Working capital and other items used $7.0M. Capital expenditures of $2.7M exceeded it, leaving free cash flow of −$16.5M.
Quarterly history
| Quarter | Form | Filed | Revenue | Y/Y | Op. margin | Net earnings | Op. cash flow |
|---|---|---|---|---|---|---|---|
| Q2 2026 | 10-Q | Aug 10, 2026 | $5.6M | 91× | -414.6% | −$11.8M | −$13.9M |
| Q1 2026 | 10-Q | May 11, 2026 | $3.7M | 95× | -556.8% | −$4.0M | −$9.4M |
| Q4 2025 | 10-K | Mar 2, 2026 | $198K | +219% | n/m | −$1.6M | −$11.0M |
| Q3 2025 | 10-Q | Nov 14, 2025 | $384K | +280% | n/m | $2.4M | −$8.7M |
| Q2 2025 | 10-Q | Aug 14, 2025 | $61K | -67% | n/m | −$36.5M | −$6.1M |
| Q1 2025 | 10-Q | May 15, 2025 | $39K | +44% | n/m | $17.0M | −$4.4M |
| Q4 2024 | 10-K | Mar 20, 2025 | $62K | -17% | n/m | −$51.2M | −$3.8M |
Charts
In supply chains and themes
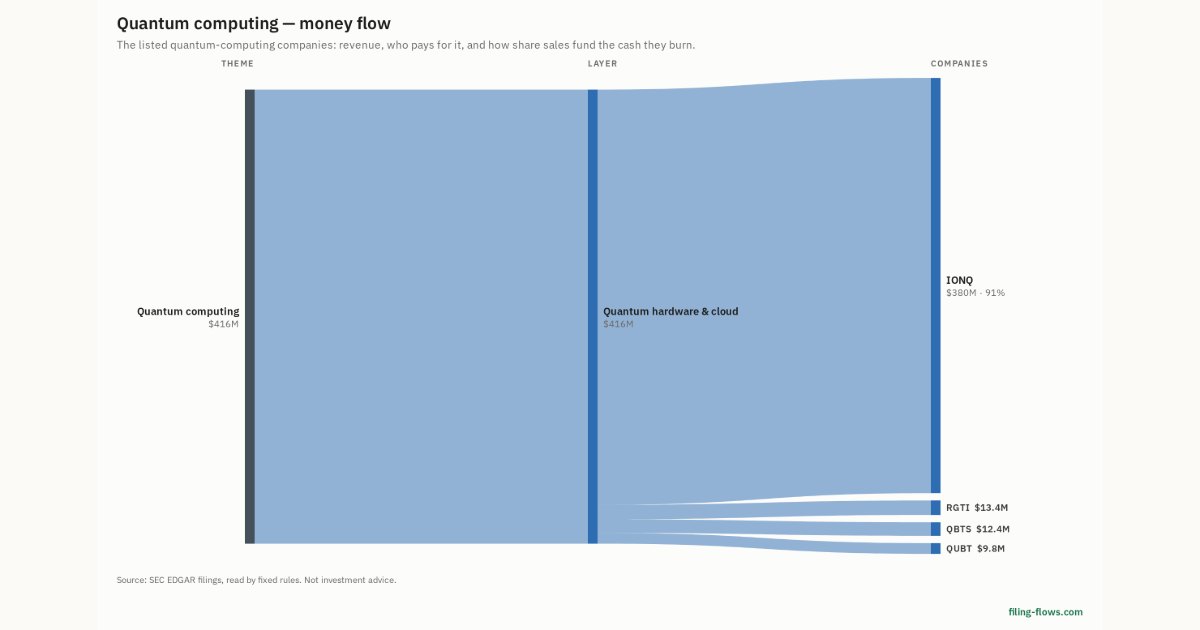
Interactive views
The same charts as the app — open one to draw it.
💵Where each $1 goesinteractive
Loading the interactive chart…
🌏Named in Asian annual reportsinteractive
Loading the interactive chart…
🔄Rotation against the market and its industry (RRG)interactive
Loading the interactive chart…
🔍Earnings qualityinteractive
Loading the interactive chart…
⚖️Fair value by methodinteractive
Loading the interactive chart…
🔭Outlook & guidanceinteractive
Loading the interactive chart…
📈Investments: gains and what it boughtinteractive
Loading the interactive chart…
🏭Its industry’s money flow (input-output)interactive
Loading the interactive chart…
About Quantum Computing
There is a large and growing demand for ever-increasing computational performance in information processing. The recent emergence of artificial intelligence (“AI”), large language models (“LLMs”), and machine learning (“ML”) algorithms has added to the need for efficient processing of vast volumes of data. Classical computers, or the computers that are currently used in home and office settings, that use silicon microprocessors are understood to have performance limitations in solving certain classes of computational problems, in particular, large-scale optimization problems. Optimization deals with finding the best solution to a problem according to a defined criteria from a set of possible solutions.
In its own words, from its 10-K, filed Mar 2, 2026.
Quantum Computing against its Services-Prepackaged Software peers
The largest companies of the same SEC industry, each at its latest quarter. Revenue growth: 91× against the peers' median +19%. Operating margin: -414.6% against the peers' median 15.2%.
| Company | Quarter | Revenue | Y/Y | Op. margin |
|---|---|---|---|---|
| QUBT Quantum Computing | Q2 2026 | $5.6M | 91× | -414.6% |
| MSFT Microsoft | Q1 FY27 | $92.3B | +19% | 49.8% |
| ORCL Oracle | Q1 FY27 | $19.3B | +30% | 34.8% |
| CRM Salesforce | Q2 FY27 | $11.3B | +11% | 20.5% |
| ADBE Adobe | Q3 FY26 | $6.8B | +13% | 34.8% |
| XYZ Block | Q3 2026 | $6.7B | +10% | 6.4% |
| INTU Intuit | Q4 FY26 | $4.4B | +14% | 10.9% |
| NOW ServiceNow | Q3 2026 | $4.1B | +20% | 9.4% |
| SHOP Shopify | Q3 2026 | $3.7B | +32% | 15.2% |
Source: Quantum Computing 10-Q on SEC EDGAR · CIK 1758009 · Services-Prepackaged Software
13F: who owns QUBT and who is buying
More on QUBT
History
Every quarter: Q2 2026 results · Q1 2026 results · Q4 2025 results · Q3 2025 results · Q2 2025 results · Q1 2025 results · Q4 2024 results