Filing Flows › Technology › Shopify (SHOP)
Shopify (SHOP) earnings and revenue breakdown
Latest: Q3 2026 · 10-Q filed Nov 3, 2026 · Shopify (SHOP) Q3 2026 earnings results →
Q3 2026 Revenue up 32% year over year to $3.7B · 12¢ of every $1 of revenue kept as net profit · operating margin 15.2%
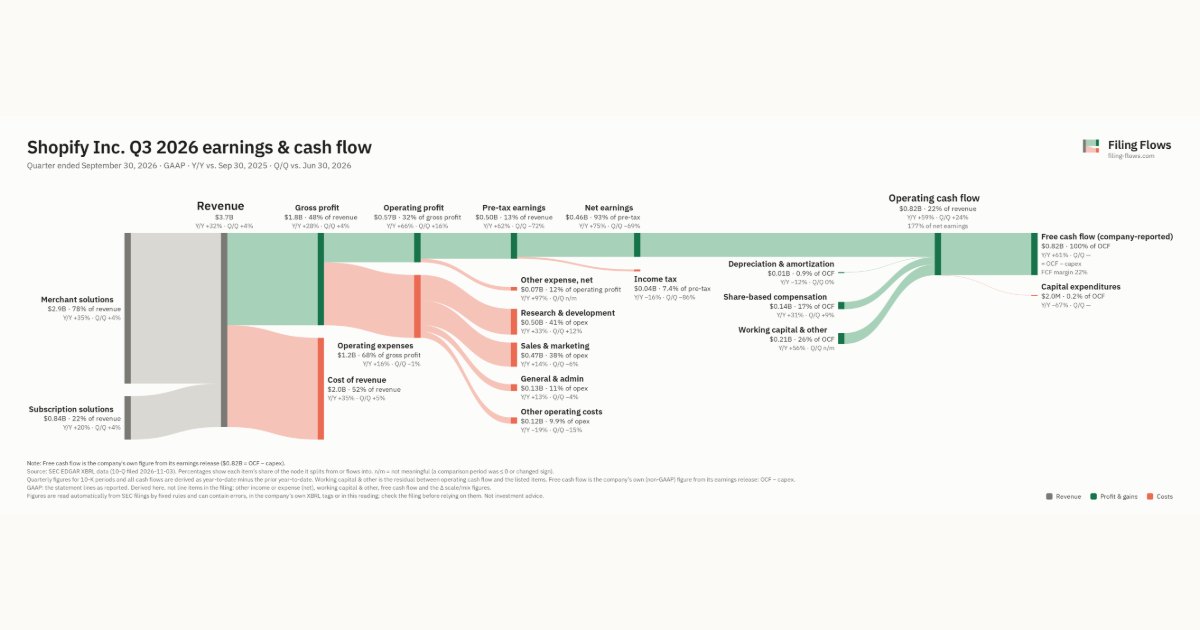
Shopify made $3.7B in Q3 2026 (+32% Y/Y): Merchant solutions $2.9B, Subscription solutions $836M. Operating margin 15.2%, net earnings $462M. See where every dollar goes — costs, profit and cash — as a Sankey from the 10-Q filed Nov 3, 2026.
Drawing the Sankey…
Open the interactive Sankey → click any line for what the company wrote about it, compare Y/Y and Q/Q, export as PNG or PDF
What changed this quarter
Revenue was $3.7B in Q3 2026, up 32% year over year and up 4% from the previous quarter. Merchant solutions was the largest line at 78% of revenue. Merchant solutions added $0.76B year over year (up 35%), 85% of the total change.
Gross margin was 47.6%, down 1.3 points from Q3 2025. Operating profit was $0.57B, a 15.2% margin (up 3.1 points year over year). Of the extra revenue versus Q3 2025, 25% reached operating profit, above the 12% margin then. Operating expenses grew 16% against revenue growth of 32%. The fastest-growing cost line was Research & development (+33%). Net earnings were $0.46B, up 75% year over year. The effective tax rate was 7.4%.
Operating cash flow was $0.82B (up 59% year over year), 177% of net earnings. Non-cash charges added back $0.01B of depreciation and amortization and $0.14B of share-based compensation. Working capital and other items added $0.21B. After capital expenditures ($2.0M), free cash flow as the company reports it was $0.82B.
Quarterly history
| Quarter | Form | Filed | Revenue | Y/Y | Op. margin | Net earnings | Op. cash flow |
|---|---|---|---|---|---|---|---|
| Q3 2026 | 10-Q | Nov 3, 2026 | $3.7B | +32% | 15.2% | $462M | $818M |
| Q2 2026 | 10-Q | Aug 5, 2026 | $3.6B | +34% | 13.6% | $1.5B | $658M |
| Q1 2026 | 10-Q | May 5, 2026 | $3.2B | +34% | 12.1% | −$581M | $481M |
| Q4 2025 | 10-K | Feb 11, 2026 | $3.7B | +31% | 17.2% | $743M | $725M |
| Q3 2025 | 10-Q | Nov 4, 2025 | $2.8B | +32% | 12.1% | $264M | $513M |
| Q2 2025 | 10-Q | Aug 6, 2025 | $2.7B | +31% | 10.9% | $906M | $428M |
| Q1 2025 | 10-Q | May 8, 2025 | $2.4B | +27% | 8.6% | −$682M | $367M |
Charts
Interactive views
The same charts as the app — open one to draw it.
💵Where each $1 goesinteractive
Loading the interactive chart…
🌏Named in Asian annual reportsinteractive
Loading the interactive chart…
🔄Rotation against the market and its industry (RRG)interactive
Loading the interactive chart…
🔍Earnings qualityinteractive
Loading the interactive chart…
⚖️Fair value by methodinteractive
Loading the interactive chart…
🔭Outlook & guidanceinteractive
Loading the interactive chart…
📈Investments: gains and what it boughtinteractive
Loading the interactive chart…
🏭Its industry’s money flow (input-output)interactive
Loading the interactive chart…
About Shopify
Shopify provides essential internet infrastructure for commerce. Shopify's all-in-one platform makes it easier to start, run and grow a business, powering sales online, in store, and everywhere in between. Shopify's mission is to make commerce better for everyone with a platform and services that are engineered for speed, customization, reliability and security, while delivering a better shopping experience for consumers everywhere. Shopify's business is designed to empower our merchants by offering a comprehensive, multi-channel commerce platform that supports their business as it grows. As owners and operators, merchants set their course, while Shopify offers them the tools to seamlessly manage, market and sell their products across various sales channels, including online storefronts, physical retail spaces, AI platforms, social media and more.
In its own words, from its 10-K, filed Feb 11, 2026.
Shopify against its Services-Prepackaged Software peers
The largest companies of the same SEC industry, each at its latest quarter. Revenue growth: +32% against the peers' median +19%. Operating margin: 15.2% against the peers' median 15.2%.
| Company | Quarter | Revenue | Y/Y | Op. margin |
|---|---|---|---|---|
| SHOP Shopify | Q3 2026 | $3.7B | +32% | 15.2% |
| MSFT Microsoft | Q1 FY27 | $92.3B | +19% | 49.8% |
| ORCL Oracle | Q1 FY27 | $19.3B | +30% | 34.8% |
| CRM Salesforce | Q2 FY27 | $11.3B | +11% | 20.5% |
| ADBE Adobe | Q3 FY26 | $6.8B | +13% | 34.8% |
| XYZ Block | Q3 2026 | $6.7B | +10% | 6.4% |
| INTU Intuit | Q4 FY26 | $4.4B | +14% | 10.9% |
| NOW ServiceNow | Q3 2026 | $4.1B | +20% | 9.4% |
| CRWV CoreWeave | Q2 2026 | $2.6B | +112% | -1.9% |
Source: Shopify 10-Q on SEC EDGAR · CIK 1594805 · Services-Prepackaged Software
Guidance and outlook
13F: who owns SHOP and who is buying
More on SHOP
History
Every quarter: Q3 2026 results · Q2 2026 results · Q1 2026 results · Q4 2025 results · Q3 2025 results · Q2 2025 results · Q1 2025 results