Filing Flows › Technology › ServiceNow (NOW)
ServiceNow (NOW) earnings and revenue breakdown
Latest: Q3 2026 · 10-Q filed Oct 28, 2026 · ServiceNow (NOW) Q3 2026 earnings results →
Q3 2026 Revenue up 20% year over year to $4.1B · 7¢ of every $1 of revenue kept as net profit · operating margin 9.4%
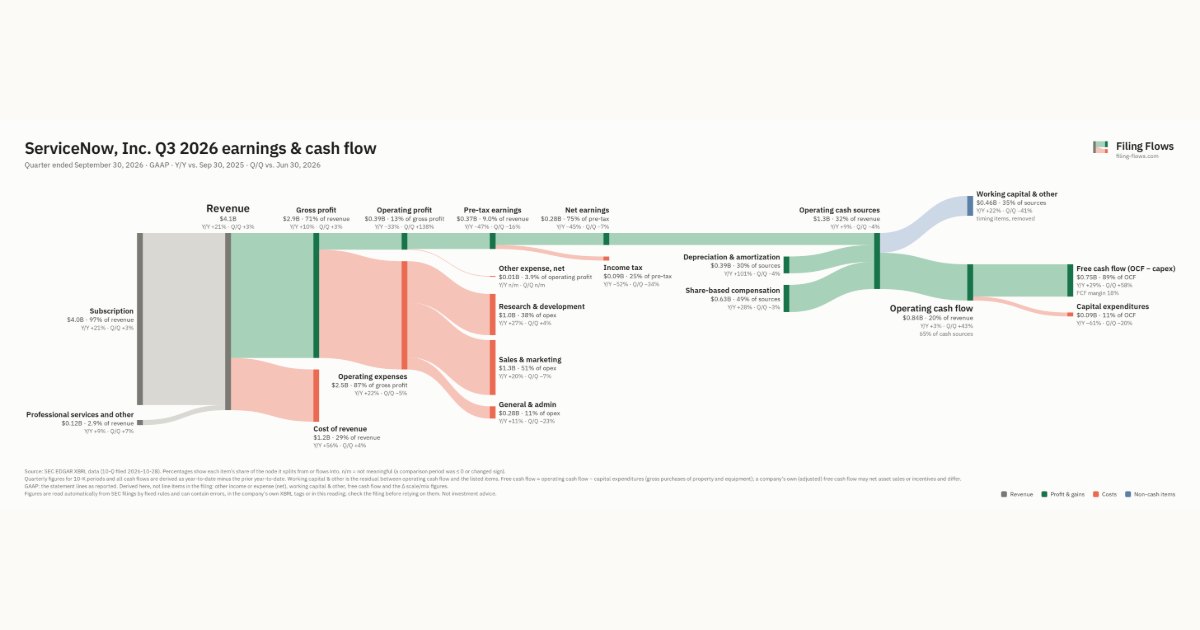
ServiceNow made $4.1B in Q3 2026 (+20% Y/Y): Subscription $4.0B, Professional services and other $118M. Operating margin 9.4%, net earnings $277M. See where every dollar goes — costs, profit and cash — as a Sankey from the 10-Q filed Oct 28, 2026.
Drawing the Sankey…
Open the interactive Sankey → click any line for what the company wrote about it, compare Y/Y and Q/Q, export as PNG or PDF
What changed this quarter
Revenue was $4.1B in Q3 2026, up 21% year over year and up 3% from the previous quarter. Subscription was the largest line at 97% of revenue. Subscription added $0.69B year over year (up 21%), 99% of the total change.
Gross margin was 70.5%, down 6.8 points from Q3 2025. Operating profit was $0.39B, a 9.4% margin (down 7.4 points year over year). Operating profit fell $0.19B even though revenue rose $0.70B versus Q3 2025, so costs grew faster than sales. Operating expenses grew 22% against revenue growth of 21%. The fastest-growing cost line was Research & development (+27%). Net earnings were $0.28B, down 45% year over year. The effective tax rate was 25.1%.
Operating cash flow was $0.84B (up 3% year over year), 303% of net earnings. Non-cash charges added back $0.39B of depreciation and amortization and $0.63B of share-based compensation. Working capital and other items used $0.46B. Capital expenditures of $0.09B left free cash flow of $0.75B.
Quarterly history
| Quarter | Form | Filed | Revenue | Y/Y | Op. margin | Net earnings | Op. cash flow |
|---|---|---|---|---|---|---|---|
| Q3 2026 | 10-Q | Oct 28, 2026 | $4.1B | +20% | 9.4% | $277M | $839M |
| Q2 2026 | 10-Q | Jul 23, 2026 | $4.0B | +24% | 4.1% | $298M | $587M |
| Q1 2026 | 10-Q | Apr 23, 2026 | $3.8B | +22% | 13.3% | $469M | $1.7B |
| Q4 2025 | 10-K | Jan 29, 2026 | $3.6B | +21% | 12.4% | $401M | $2.2B |
| Q3 2025 | 10-Q | Oct 30, 2025 | $3.4B | +22% | 16.8% | $502M | $813M |
| Q2 2025 | 10-Q | Jul 24, 2025 | $3.2B | +22% | 11.1% | $385M | $716M |
| Q1 2025 | 10-Q | Apr 23, 2025 | $3.1B | +19% | 14.6% | $460M | $1.7B |
Charts
In supply chains and themes
Interactive views
The same charts as the app — open one to draw it.
💵Where each $1 goesinteractive
Loading the interactive chart…
🌏Named in Asian annual reportsinteractive
Loading the interactive chart…
🔄Rotation against the market and its industry (RRG)interactive
Loading the interactive chart…
🔍Earnings qualityinteractive
Loading the interactive chart…
⚖️Fair value by methodinteractive
Loading the interactive chart…
🔭Outlook & guidanceinteractive
Loading the interactive chart…
📈Investments: gains and what it boughtinteractive
Loading the interactive chart…
🏭Its industry’s money flow (input-output)interactive
Loading the interactive chart…
About ServiceNow
ServiceNow (NYSE: NOW) is the AI control tower for business reinvention. The ServiceNow AI Platform integrates with any cloud, any model, and any data source to orchestrate how work flows across the enterprise. By unifying legacy systems, departmental tools, cloud applications, and AI agents, ServiceNow provides a single pane of glass that connects intelligence to execution across every corner of business. With more than 100 billion workflows running on the platform each year, ServiceNow helps organizations turn fragmented operations into coordinated, autonomous workflows that deliver measurable results. Learn how ServiceNow puts AI to work for people at www.servicenow.com.
In its own words, from its 8-K, filed Jul 22, 2026.
ServiceNow against its Services-Prepackaged Software peers
The largest companies of the same SEC industry, each at its latest quarter. Revenue growth: +20% against the peers' median +19%. Operating margin: 9.4% against the peers' median 15.2%.
| Company | Quarter | Revenue | Y/Y | Op. margin |
|---|---|---|---|---|
| NOW ServiceNow | Q3 2026 | $4.1B | +20% | 9.4% |
| MSFT Microsoft | Q1 FY27 | $92.3B | +19% | 49.8% |
| ORCL Oracle | Q1 FY27 | $19.3B | +30% | 34.8% |
| CRM Salesforce | Q2 FY27 | $11.3B | +11% | 20.5% |
| ADBE Adobe | Q3 FY26 | $6.8B | +13% | 34.8% |
| XYZ Block | Q3 2026 | $6.7B | +10% | 6.4% |
| INTU Intuit | Q4 FY26 | $4.4B | +14% | 10.9% |
| SHOP Shopify | Q3 2026 | $3.7B | +32% | 15.2% |
| CRWV CoreWeave | Q2 2026 | $2.6B | +112% | -1.9% |
Source: ServiceNow 10-Q on SEC EDGAR · CIK 1373715 · Services-Prepackaged Software
13F: who owns NOW and who is buying
More on NOW
History
Every quarter: Q3 2026 results · Q2 2026 results · Q1 2026 results · Q4 2025 results · Q3 2025 results · Q2 2025 results · Q1 2025 results
- ServiceNow guidance history: guided vs reported
- ServiceNow gross margin by quarter
- ServiceNow operating margin by quarter
- ServiceNow net income by quarter
- ServiceNow free cash flow by quarter
- ServiceNow R&D spending by quarter
- ServiceNow capital expenditures by quarter
- ServiceNow Subscription revenue by quarter
- ServiceNow Professional services and other revenue by quarter