Filing Flows › Technology › Red Cat Holdings (RCAT)
Red Cat Holdings (RCAT) earnings and revenue breakdown
Latest: Q2 2026 · 10-Q filed Aug 6, 2026 · Red Cat Holdings (RCAT) Q2 2026 earnings results →
Q2 2026 Revenue up 527% year over year to $20.2M · 175¢ of every $1 of revenue lost · operating margin -191.4%
Red Cat Holdings made $20.2M in Q2 2026 (+527% Y/Y): Product $19.7M, Service $477K. Operating margin -191.4%, net loss $35.3M. See where every dollar goes — costs, profit and cash — as a Sankey from the 10-Q filed Aug 6, 2026.
Drawing the Sankey…
Open the interactive Sankey → click any line for what the company wrote about it, compare Y/Y and Q/Q, export as PNG or PDF
What changed this quarter
Revenue was $20.2M in Q2 2026, up 527% year over year and up 30% from the previous quarter. Product was the largest line at 98% of revenue. Product added $17.6M year over year (up 843%), 104% of the total change. Service declined 58%.
Gross margin was 16.1%, up 4.5 points from Q2 2025. Operating costs exceeded revenue by $38.6M, an operating margin of -191.4%. Operating expenses grew 222% against revenue growth of 527%. The fastest-growing cost line was Research & development (+295%). The quarter ended with a net loss of $35.3M, wider than the previous quarter's $26.6M loss.
Operating cash flow was −$46.8M. Non-cash charges added back $1.5M of depreciation and amortization and $5.0M of share-based compensation. Working capital and other items used $18.1M. Capital expenditures of $5.8M exceeded it, leaving free cash flow of −$52.6M.
Quarterly history
| Quarter | Form | Filed | Revenue | Y/Y | Op. margin | Net earnings | Op. cash flow |
|---|---|---|---|---|---|---|---|
| Q2 2026 | 10-Q | Aug 6, 2026 | $20.2M | +527% | -191.4% | −$35.3M | −$46.8M |
| Q1 2026 | 10-Q | May 7, 2026 | $15.5M | +849% | -176.5% | −$26.6M | −$31.9M |
| Q4 2025 | 10-K | Mar 19, 2026 | $26.2M | — | -91.3% | −$19.7M | −$36.5M |
| Q3 2025 | 10-Q | Nov 13, 2025 | $9.6M | +646% | -181.7% | −$16.0M | −$23.9M |
| Q2 2025 | 10-Q | Aug 14, 2025 | $3.2M | -50% | -392.9% | −$13.3M | −$12.9M |
| Q1 2025 | 10-Q | May 14, 2025 | $1.6M | -75% | -765.7% | −$23.1M | −$15.9M |
| Q1 2024 | 10-K | Aug 8, 2024 | $6.3M | +485% | -119.0% | −$7.1M | −$2.4M |
Charts
In supply chains and themes
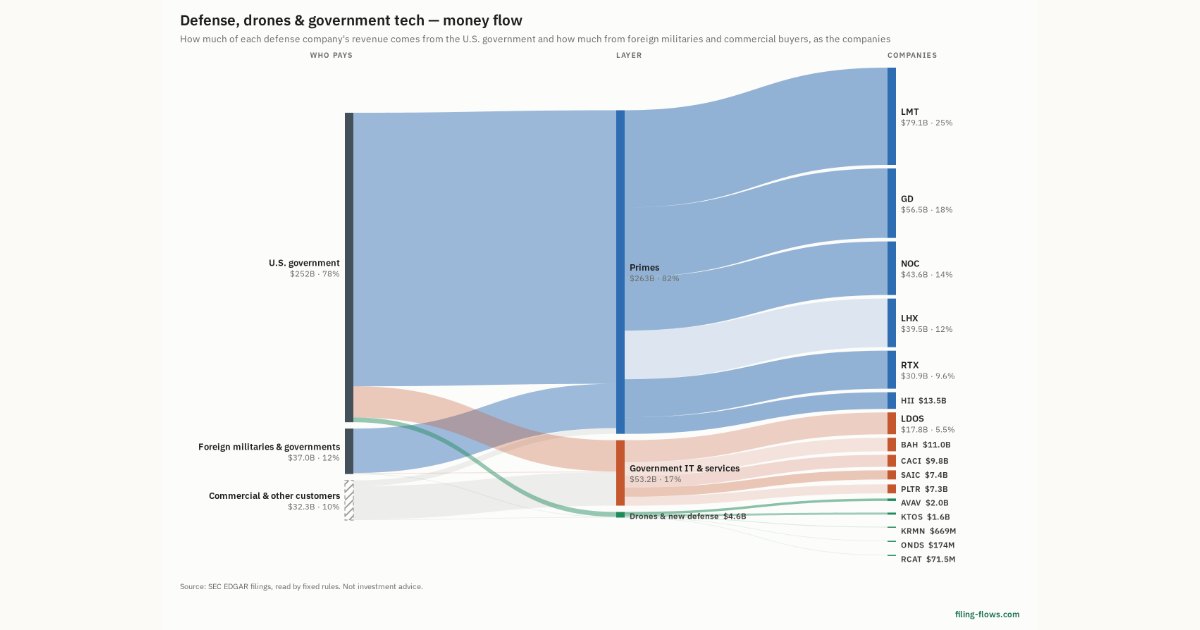
Interactive views
The same charts as the app — open one to draw it.
💵Where each $1 goesinteractive
Loading the interactive chart…
🌏Named in Asian annual reportsinteractive
Loading the interactive chart…
🔄Rotation against the market and its industry (RRG)interactive
Loading the interactive chart…
🔍Earnings qualityinteractive
Loading the interactive chart…
⚖️Fair value by methodinteractive
Loading the interactive chart…
🔭Outlook & guidanceinteractive
Loading the interactive chart…
📈Investments: gains and what it boughtinteractive
Loading the interactive chart…
🏭Its industry’s money flow (input-output)interactive
Loading the interactive chart…
Customers and suppliers named in filings
Sells to
- U.S. government — 73% of its revenue · Stated in 10-K (sentence) · source
About Red Cat Holdings
We are a U.S.-based provider of advanced all-domain drone and robotic solutions for defense, national security, and commercial applications. We develop American-made hardware and software that supports military, government, and public safety operations across air, land, and sea. Our family of systems delivers tactical capabilities in small, unmanned aircraft systems (sUAS) and uncrewed surface vessels (USVs), delivering integrated platforms designed to enhance safety and multi-domain mission effectiveness. We were originally incorporated under the laws of the State of Colorado in 1984 under the name Oravest International, Inc. In November 2016, we changed our name to TimefireVR, Inc. and re-incorporated in Nevada.
In its own words, from its 10-K, filed Mar 19, 2026.
Red Cat Holdings against its Services-Prepackaged Software peers
The largest companies of the same SEC industry, each at its latest quarter. Revenue growth: +527% against the peers' median +19%. Operating margin: -191.4% against the peers' median 15.2%.
| Company | Quarter | Revenue | Y/Y | Op. margin |
|---|---|---|---|---|
| RCAT Red Cat Holdings | Q2 2026 | $20.2M | +527% | -191.4% |
| MSFT Microsoft | Q1 FY27 | $92.3B | +19% | 49.8% |
| ORCL Oracle | Q1 FY27 | $19.3B | +30% | 34.8% |
| CRM Salesforce | Q2 FY27 | $11.3B | +11% | 20.5% |
| ADBE Adobe | Q3 FY26 | $6.8B | +13% | 34.8% |
| XYZ Block | Q3 2026 | $6.7B | +10% | 6.4% |
| INTU Intuit | Q4 FY26 | $4.4B | +14% | 10.9% |
| NOW ServiceNow | Q3 2026 | $4.1B | +20% | 9.4% |
| SHOP Shopify | Q3 2026 | $3.7B | +32% | 15.2% |
Source: Red Cat Holdings 10-Q on SEC EDGAR · CIK 748268 · Services-Prepackaged Software
13F: who owns RCAT and who is buying
More on RCAT
History
Every quarter: Q2 2026 results · Q1 2026 results · Q4 2025 results · Q3 2025 results · Q2 2025 results · Q1 2025 results · Q1 2024 results