Filing Flows › Technology › SentinelOne (S)
SentinelOne (S) earnings and revenue breakdown
Latest: Q2 FY27 · 10-Q filed Aug 28, 2026 · SentinelOne (S) Q2 FY27 earnings results →
Q2 FY27 Revenue up 21% year over year to $292M · 32¢ of every $1 of revenue lost · operating margin -31.1%
SentinelOne made $292M in Q2 FY27 (+21% Y/Y). Operating margin -31.1%, net loss $93.4M. See where every dollar goes — costs, profit and cash — as a Sankey from the 10-Q filed Aug 28, 2026.
Drawing the Sankey…
Open the interactive Sankey → click any line for what the company wrote about it, compare Y/Y and Q/Q, export as PNG or PDF
What changed this quarter
Revenue was $292.0M in Q2 FY27, up 21% year over year and up 6% from the previous quarter.
Gross margin was 72.1%, down 3.0 points from Q2 FY26. Operating costs exceeded revenue by $90.8M, an operating margin of -31.1%. Operating expenses grew 15% against revenue growth of 21%. The fastest-growing cost line was Other operating costs (+529%). The quarter ended with a net loss of $93.4M, wider than the previous quarter's $76.2M loss.
Operating cash flow was −$6.5M. Non-cash charges added back $19.0M of depreciation and amortization and $92.1M of share-based compensation. Working capital and other items used $24.2M. Capital expenditures of $70K exceeded it, leaving free cash flow of −$6.6M.
Quarterly history
| Quarter | Form | Filed | Revenue | Y/Y | Op. margin | Net earnings | Op. cash flow |
|---|---|---|---|---|---|---|---|
| Q2 FY27 | 10-Q | Aug 28, 2026 | $292M | +21% | -31.1% | −$93.4M | −$6.5M |
| Q1 FY27 | 10-Q | May 28, 2026 | $277M | +21% | -28.8% | −$76.2M | $38.5M |
| Q4 FY26 | 10-K | Mar 19, 2026 | $271M | +20% | -29.5% | −$110M | $4.4M |
| Q3 FY26 | 10-Q | Dec 4, 2025 | $259M | +23% | -28.3% | −$60.3M | $21.0M |
| Q2 FY26 | 10-Q | Aug 28, 2025 | $242M | +22% | -33.3% | −$72.0M | −$1.0M |
| Q1 FY26 | 10-Q | May 28, 2025 | $229M | +23% | -38.2% | −$208M | $52.3M |
| Q4 FY25 | 10-K | Mar 26, 2025 | $226M | +30% | -35.6% | −$70.8M | −$3.4M |
Charts
In supply chains and themes
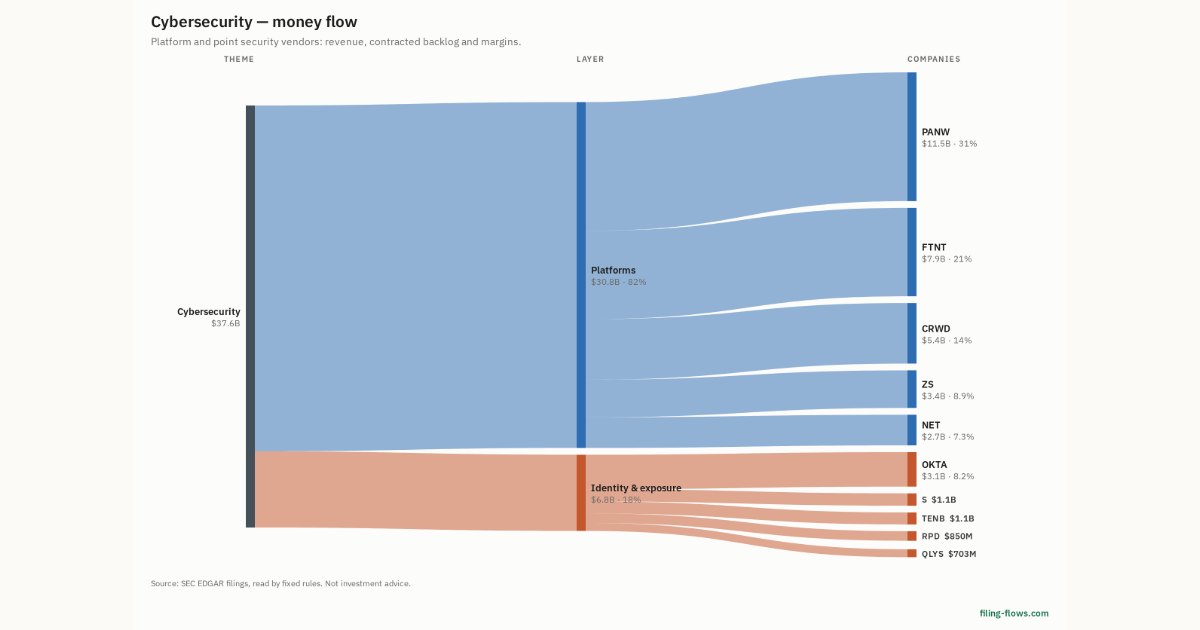
Interactive views
The same charts as the app — open one to draw it.
💵Where each $1 goesinteractive
Loading the interactive chart…
🌏Named in Asian annual reportsinteractive
Loading the interactive chart…
🔄Rotation against the market and its industry (RRG)interactive
Loading the interactive chart…
🔍Earnings qualityinteractive
Loading the interactive chart…
⚖️Fair value by methodinteractive
Loading the interactive chart…
🔭Outlook & guidanceinteractive
Loading the interactive chart…
📈Investments: gains and what it boughtinteractive
Loading the interactive chart…
🏭Its industry’s money flow (input-output)interactive
Loading the interactive chart…
About SentinelOne
Cybersecurity is indispensable to our digital way of life, with millions of cyberattacks resulting in trillions of dollars in damages. We are in the midst of a generational shift in cybersecurity, ushered in by the ongoing digital transformation of the enterprise and the rise of AI. Attacks can inflict damages that span operational disruption, leadership change, loss of customer trust, and intellectual property theft, among others. The persistence and speed of cyberattacks clearly shows that there is a long way to go from here. Enterprises must deploy solutions that enable them to stay one step ahead of attackers and address intrusion attempts in real-time at machine speed—empowering human operators with the speed, scale, visibility, and precision of technology.
In its own words, from its 10-K, filed Mar 19, 2026.
SentinelOne against its Services-Prepackaged Software peers
The largest companies of the same SEC industry, each at its latest quarter. Revenue growth: +21% against the peers' median +19%. Operating margin: -31.1% against the peers' median 15.2%.
| Company | Quarter | Revenue | Y/Y | Op. margin |
|---|---|---|---|---|
| S SentinelOne | Q2 FY27 | $292M | +21% | -31.1% |
| MSFT Microsoft | Q1 FY27 | $92.3B | +19% | 49.8% |
| ORCL Oracle | Q1 FY27 | $19.3B | +30% | 34.8% |
| CRM Salesforce | Q2 FY27 | $11.3B | +11% | 20.5% |
| ADBE Adobe | Q3 FY26 | $6.8B | +13% | 34.8% |
| XYZ Block | Q3 2026 | $6.7B | +10% | 6.4% |
| INTU Intuit | Q4 FY26 | $4.4B | +14% | 10.9% |
| NOW ServiceNow | Q3 2026 | $4.1B | +20% | 9.4% |
| SHOP Shopify | Q3 2026 | $3.7B | +32% | 15.2% |
Source: SentinelOne 10-Q on SEC EDGAR · CIK 1583708 · Services-Prepackaged Software
Guidance and outlook
13F: who owns S and who is buying
More on S
History
Every quarter: Q2 FY27 results · Q1 FY27 results · Q4 FY26 results · Q3 FY26 results · Q2 FY26 results · Q1 FY26 results · Q4 FY25 results