Filing Flows › Communication Services › Skydance (SKYD)
Skydance (SKYD) earnings and revenue breakdown
Latest: Q3 2026 · 10-Q filed Nov 9, 2026 · Skydance (SKYD) Q3 2026 earnings results →
Q3 2026 1¢ of every $1 of revenue kept as net profit · operating margin 5.2%
Skydance made $7.0B in Q3 2026: Affiliate and subscription $3.5B, Advertising $1.9B, Licensing and other $1.5B. Operating margin 5.2%, net earnings $73.0M. See where every dollar goes — costs, profit and cash — as a Sankey from the 10-Q filed Nov 9, 2026.
Drawing the Sankey…
Open the interactive Sankey → click any line for what the company wrote about it, compare Y/Y and Q/Q, export as PNG or PDF
What changed this quarter
Revenue was $7.0B in Q3 2026, up 2% from the previous quarter. Affiliate and subscription was the largest line at 50% of revenue.
Operating profit was $0.37B, a 5.2% margin. Net earnings were $0.07B. The effective tax rate was 82.6%. Non-operating items added $0.19B, 35% of pre-tax earnings, so the bottom line overstates operating performance.
Operating cash flow was $0.12B, 126% of net income including minority interests. Non-cash charges added back $0.37B of depreciation and amortization and $0.10B of share-based compensation. Working capital and other items used $0.45B. Capital expenditures of $0.09B left free cash flow of $0.03B.
Quarterly history
| Quarter | Form | Filed | Revenue | Y/Y | Op. margin | Net earnings | Op. cash flow |
|---|---|---|---|---|---|---|---|
| Q3 2026 | 10-Q | Nov 9, 2026 | $7.0B | — | 5.2% | $73.0M | $123M |
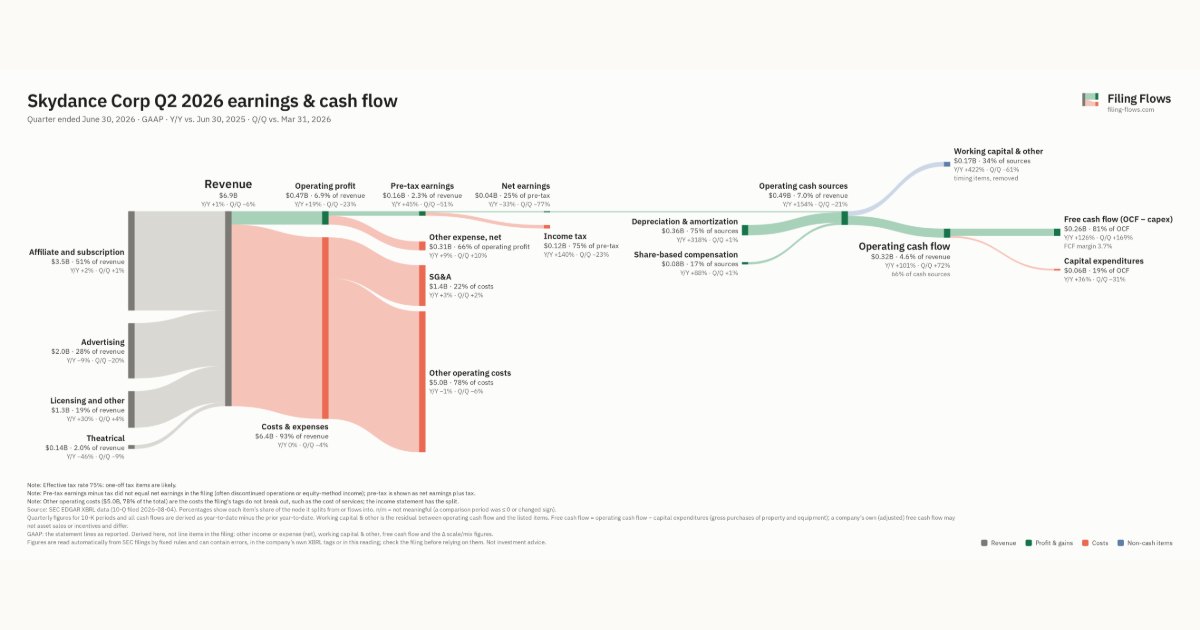
| Q2 2026 | 10-Q | Aug 4, 2026 | $6.9B | +0.9% | 6.9% | $41.0M | $319M |
| Q1 2026 | 10-Q | May 4, 2026 | $7.3B | +2% | 8.4% | $168M | $185M |
Charts
Interactive views
The same charts as the app — open one to draw it.
💵Where each $1 goesinteractive
Loading the interactive chart…
🌏Named in Asian annual reportsinteractive
Loading the interactive chart…
🔄Rotation against the market and its industry (RRG)interactive
Loading the interactive chart…
🔍Earnings qualityinteractive
Loading the interactive chart…
⚖️Fair value by methodinteractive
Loading the interactive chart…
🔭Outlook & guidanceinteractive
Loading the interactive chart…
📈Investments: gains and what it boughtinteractive
Loading the interactive chart…
🏭Its industry’s money flow (input-output)interactive
Loading the interactive chart…
About Skydance
Description of Business —Paramount Skydance Corporation is a global media and entertainment company with a MTV, BET, Comedy Central, Showtime, Paramount+, Pluto TV, and Skydance Animation, Film, and Television,
In its own words, from its 10-Q, filed Aug 4, 2026.
Skydance against its Television Broadcasting Stations peers
The largest companies of the same SEC industry, each at its latest quarter. Operating margin: 5.2% against the peers' median 15.0%.
| Company | Quarter | Revenue | Y/Y | Op. margin |
|---|---|---|---|---|
| SKYD Skydance | Q3 2026 | $7.0B | — | 5.2% |
| FOXA Fox | Q1 FY27 | $4.6B | +22% | 28.1% |
| NXST Nexstar Media Group | Q3 2026 | $2.1B | +78% | 24.9% |
| VSNT Versant Media Group | Q3 2026 | $1.6B | -4% | 6.9% |
| FWONA Liberty Media | Q3 2026 | $1.2B | +13% | 19.3% |
| GTN Gray Media | Q3 2026 | $972M | +30% | 27.4% |
| SBGI Sinclair | Q3 2026 | $893M | +16% | 15.0% |
| SSP E.W. Scripps | Q3 2026 | $545M | +4% | 12.3% |
| EVC Entravision Communications | Q3 2026 | $226M | +88% | 12.5% |
Source: Skydance 10-Q on SEC EDGAR · CIK 2041610 · Television Broadcasting Stations
Guidance and outlook
13F: who owns SKYD and who is buying
More on SKYD
History
Every quarter: Q3 2026 results · Q2 2026 results · Q1 2026 results