Filing Flows › Consumer Discretionary › SharkNinja (SN)
SharkNinja (SN) earnings and revenue breakdown
Latest: Q3 2026 · 10-Q filed Nov 4, 2026 · SharkNinja (SN) Q3 2026 earnings results →
Q3 2026 Revenue up 21% year over year to $2.0B · 17¢ of every $1 of revenue kept as net profit · operating margin 22.4%
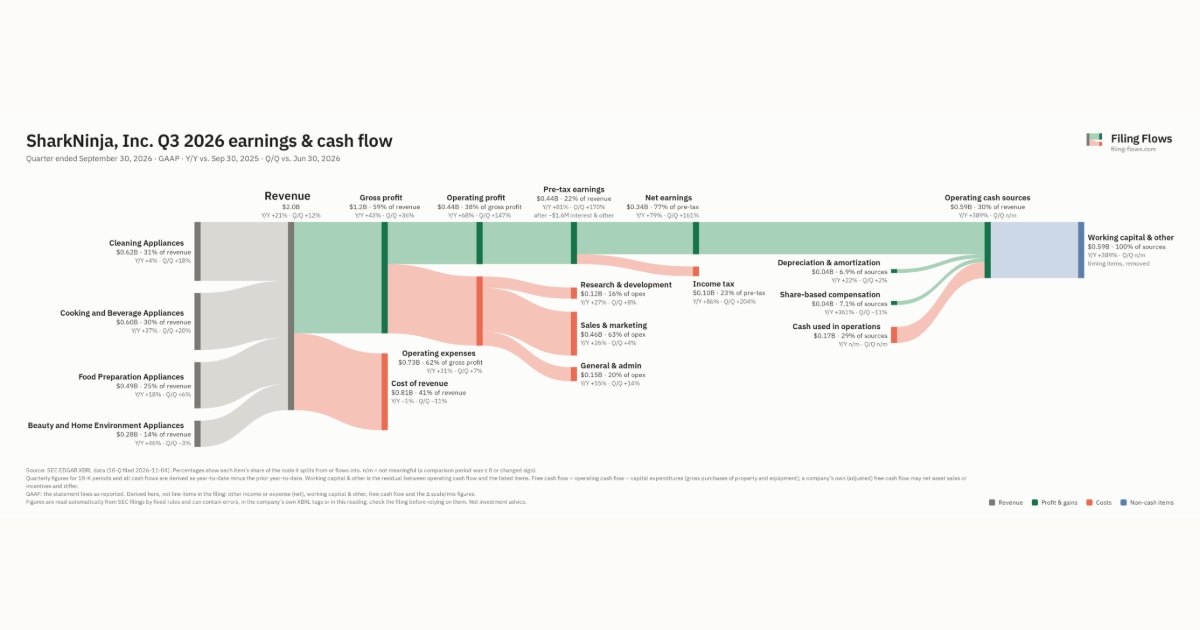
SharkNinja made $2.0B in Q3 2026 (+21% Y/Y): Cleaning Appliances $617M, Cooking and Beverage Appliances $598M, Food Preparation Appliances $485M. Operating margin 22.4%, net earnings $338M. See where every dollar goes — costs, profit and cash — as a Sankey from the 10-Q filed Nov 4, 2026.
Drawing the Sankey…
Open the interactive Sankey → click any line for what the company wrote about it, compare Y/Y and Q/Q, export as PNG or PDF
What changed this quarter
Revenue was $2.0B in Q3 2026, up 21% year over year and up 12% from the previous quarter. Cleaning Appliances was the largest line at 31% of revenue. Cooking and Beverage Appliances added $0.16B year over year (up 37%), 46% of the total change.
Gross margin was 59.2%, up 9.1 points from a year earlier. Operating profit was $0.44B, a 22.4% margin (up 6.3 points year over year). Of the extra revenue versus a year earlier, 52% reached operating profit, above the 16% margin then. Operating expenses grew 31% against revenue growth of 21%. The fastest-growing cost line was General & admin (+55%). Net earnings were $0.34B, up 79% year over year. The effective tax rate was 23.3%.
Operating cash flow was −$0.17B. Non-cash charges added back $0.04B of depreciation and amortization and $0.04B of share-based compensation. Working capital and other items used $0.59B. Capital expenditures of $0.04B exceeded it, leaving free cash flow of −$0.21B.
Quarterly history
| Quarter | Form | Filed | Revenue | Y/Y | Op. margin | Net earnings | Op. cash flow |
|---|---|---|---|---|---|---|---|
| Q3 2026 | 10-Q | Nov 4, 2026 | $2.0B | +21% | 22.4% | $338M | −$168M |
| Q2 2026 | 10-Q | Aug 5, 2026 | $1.8B | +22% | 10.2% | $130M | $432M |
| Q1 2026 | 10-Q | May 6, 2026 | $1.4B | +16% | 11.6% | $121M | −$156M |
Charts
Interactive views
The same charts as the app — open one to draw it.
💵Where each $1 goesinteractive
Loading the interactive chart…
🌏Named in Asian annual reportsinteractive
Loading the interactive chart…
🔄Rotation against the market and its industry (RRG)interactive
Loading the interactive chart…
🔍Earnings qualityinteractive
Loading the interactive chart…
⚖️Fair value by methodinteractive
Loading the interactive chart…
🔭Outlook & guidanceinteractive
Loading the interactive chart…
📈Investments: gains and what it boughtinteractive
Loading the interactive chart…
🏭Its industry’s money flow (input-output)interactive
Loading the interactive chart…
About SharkNinja
The Company has identified two operating segments, Domestic and International, which are aggregated into one reportable segment that derives revenues from customers through the sale of the Company’s small household appliances, which are sold under two brands, Shark and Ninja. SharkNinja is a global product design and technology company that creates 5-star rated lifestyle solutions through innovative products for consumers around the world. We seek to leverage our global, agile and cross-functional engineering know-how, product development and manufacturing expertise along with our solutions-driven marketing to increase the efficiency, convenience and enjoyment of consumers’ daily tasks and improve everyday lives.
In its own words, from its 10-K, filed Mar 2, 2026.
SharkNinja against its Household Appliances peers
The largest companies of the same SEC industry, each at its latest quarter. Revenue growth: +21% against the peers' median -0.2%. Operating margin: 22.4% against the peers' median 0.1%.
| Company | Quarter | Revenue | Y/Y | Op. margin |
|---|---|---|---|---|
| SN SharkNinja | Q3 2026 | $2.0B | +21% | 22.4% |
| WHR Whirlpool | Q3 2026 | $3.7B | -9% | 0.1% |
| AOS Smith A O | Q3 2026 | $940M | -0.2% | 18.5% |
| COOK Traeger | Q3 2026 | $74.7M | -40% | -26.5% |
| TKLS Trutankless | Q2 2026 | $539K | +470% | -423.8% |
Source: SharkNinja 10-Q on SEC EDGAR · CIK 1957132 · Household Appliances
Guidance and outlook
More on SN
History
Every quarter: Q3 2026 results · Q2 2026 results · Q1 2026 results
- SharkNinja guidance history: guided vs reported
- SharkNinja gross margin by quarter
- SharkNinja operating margin by quarter
- SharkNinja net income by quarter
- SharkNinja R&D spending by quarter
- SharkNinja Cleaning Appliances revenue by quarter
- SharkNinja Cooking and Beverage Appliances revenue by quarter
- SharkNinja Food Preparation Appliances revenue by quarter